You must be a member to access this resource.
to learn more, or contact our membership team at or (202) 383-2500 to discuss becoming an ACP member.
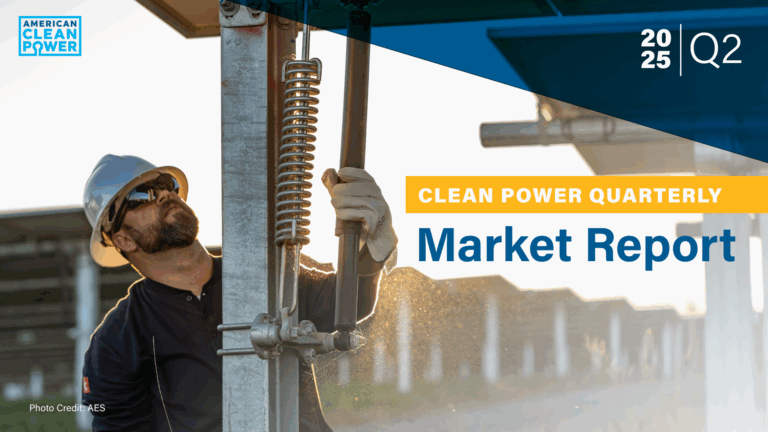
Federal chaos sparks warning signs for clean energy investment, according to Q2 data. ACP’s Clean Power Quarterly Market Report shows U.S. developers deployed over 11 gigawatts (GW) of new utility-scale solar, wind, and energy storage capacity worth $15.2 billion in investment—but the clean power development pipeline showed virtually no growth and Power Purchase Agreements (PPAs) plummeted.
While Q2 2025 brought the total operating capacity of clean power in the U.S. to over 332 GW, it represents less than a 1% increase over Q2 2024 amidst concerning signs for the industry. The clean power development pipeline showed virtually no growth (expanding by less than 100 MW to 184.5 GW), solar installations declined 23% in the first half of 2025, and Power Purchase Agreements (PPAs) plummeted—early indicators of federal policy attacks and fluctuating trade policy undermining American energy security and economic growth.
“America’s clean energy industry continues to add much needed power to the grid. Unfortunately, federal policy obstacles and restrictive mandates are threatening hundreds of billions in planned energy investment,” said ACP CEO Jason Grumet. “The uncertainty created by new bureaucratic delays and unclear demands is having a chilling effect on the pipeline for future energy projects, stalling growth precisely when our nation needs more energy to power a growing economy.”
Read the press release.
Key Highlights
- Total Installed Capacity: As of June 30, the U.S. had 330+ GW of clean power capacity in operation, enough to power more than 81 million homes.
- Procurement Falls Dramatically: The first half of 2025 saw a 32% decrease in capacity being contracted through Purchase Power Agreements compared to the first half of 2024. Other types of agreements are down 48%, compared to the first half of 2024.
- Project Pipeline Growth Stagnates: The clean power pipeline sat at 184,500 MW at the end of Q2, up only 100 MW from the end of the first quarter of 2025.
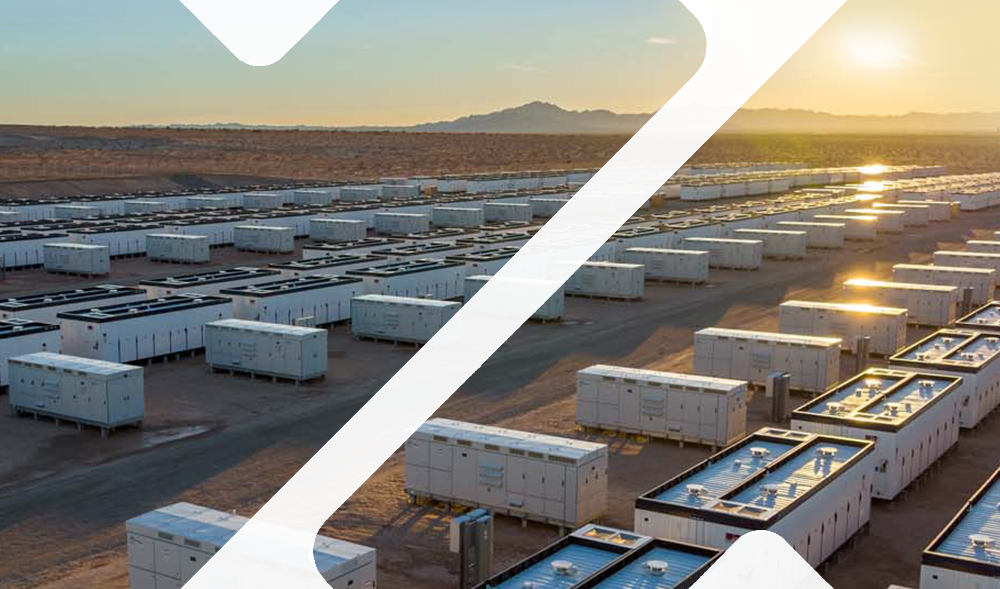
- Storage Continues to Climb: Developers added over 6.5 GW in the first half of 2025, 63% more than the first half of 2024.
- Construction Goes Forward: At midyear 2025, developers reported that 83,403 MW of projects were under construction, spanning 580 projects. Construction activity was highest in Texas (21 GW) followed by Arizona (7.8 GW), California (7.2 GW), New Mexico (4.8 GW) and Wyoming (4.1 GW).
- Major Growth in Arizona: Arizona became the latest state to surpass 10 GW of clean power installed, after adding 1,220 MW of new solar capacity and 1,369 MW of new storage capacity in the quarter. The state now hosts the third-largest storage fleet and fifth-largest utility-scale solar capacity in the country, as well as the second-largest clean power pipeline after Texas.
- States Rely on Solar: Texas, Indiana, Arkansas, Kansas, and Michigan added mostly new solar, while Illinois was the only state in the quarterly top ten to add mostly wind capacity.
- Power Doesn’t Need to be Political: Eight of the top ten states for Q2 clean power additions voted Republican in the most recent presidential election.
Read the Report Now
Download the complete Q2 2025 Clean Power Quarterly Report for detailed state-by-state analysis, technology deep-dives, and comprehensive market data.
- Public version: A free version is available to download.
- Full Report (ACP Members): Log in to access the complete report from this page with detailed datasets and analysis.
You can also watch the PowerCast for a deep-dive led by ACP’s clean power market intelligence leadership.