American Clean Power

CleanPower IQ

The most powerful database & data visualization tool in the clean power industry.  

FAST. ACCURATE. ACTIONABLE.

Gain the clean power project data advantage you need—for market intelligence, policy advocacy, and strategic decision-making.

CleanPowerIQ is your one-stop, interactive platform for the most comprehensive and timely data on clean energy projects across the United States. With project data going as far back as 1981, CleanPowerIQ captures information about projects since wind, solar, and energy storage became commercial technologies in the U.S.

CleanPowerIQ access is limited to ACP Business, Executive, and Board Level members. If you have questions about access, please email [email protected].

Access CleanPowerIQ Now

Preview of the CleanPowerIQ Dashboard

Real-time data certainty.

CleanPowerIQ Data Advantage

CleanPowerIQ delivers verified, up-to-date insights you can trust—refreshed daily with input directly from project developers, owners, and buyers. Each data point is grounded in company confirmation and validated by ACP’s in-house analysts, who cross-reference a wide array of third-party sources to ensure accuracy and depth. Unlike platforms that rely solely on static public data, CleanPowerIQ reflects the real-time state of the market.

Read our Methodology

How Can CPIQ Help You?

Clean energy data that’s not just accessible—but actionable. Discover how CPIQ can help you by reading the real-world examples below.

Advocacy

Example: A company lobbyist has a meeting on the hill with a key member of congress and needs to gather collateral regarding the presence of the industry in the member’s district.

Solution: In a just a few minutes, CleanPowerIQ can provide a summary of all the clean power assets in the member’s district and a state fact sheet detailing the economic, employment, and environmental benefits the industry provides.

Media & Communications

Example: A communications professional is designing a campaign to promote clean energy at the Iowa State Fair.

Solution: CleanPowerIQ can tell users exactly how much wind, solar, and storage power Iowa’s electrical grid, with quick takeaways on the state fact sheet for how much the industry has invested in the state.

Business Development

Example: A business development manager is working to prioritize sales calls and optimize the efficiency of her/his team.

Solution: With a multitude of querying and sorting capabilities, CleanPowerIQ allows the users to quickly narrow in on projects with a specific turbine manufacture or model, focus on projects of a specific size, build year, or build location, or capture new or missing projects from previous searches. All these actions help to focus time and discover the right customers.


Workers suspended working on a wind turbine project.

Manufacturing

Example: A large component manufacturer is considering building a new manufacturing facility to supply increasing clean power demand.

Solution: CleanPowerIQ can quickly show the geographic footprint of their existing product placement and highlight geographic trends for future deployment. This ability to see where projects are being actively developed and constructed not only helps inform site selection but can also highlight potential customers that can be supplied from existing facilities.

Photo of a manufacturer in shadow working on a wind turbine.

Procurement

Example: A director of strategy needs more visibility into where PPAs are being signed with what companies.

Solution: CleanPowerIQ provides essential information about the type of clean power buyers involved, the kind of procurement agreement, and duration of the agreement.


Market Analysis

 Example: A market analyst has been asked to research prospects for wind repowering in certain states.

Solution: CleanPowerIQ can not only show the age of wind projects, but also each project’s history of previous repowering activity, including distinguishing between partial and full.

Market Analysis

Frequently Asked Questions About CleanPowerIQ

Read Our FAQ Learn More
What is included in CleanPowerIQ?

CleanPowerIQ delivers the most comprehensive, real-time database of clean energy projects available today -designed to power your decisions, advocacy, and analysis.

  • 50+ Up-to-Date Project Attributes: Instantly access detailed information on operational status, nameplate capacity, location, equipment specs, procurement details, and more.
  • Deep Tech-Specific Insights: Get the data that matters—battery storage duration, solar tracker types, wind turbine hub heights and rotor diameters—optimized for granular market intelligence.
  • Geographically Searchable & Advocacy-Ready: Search by county, state, congressional district, or state legislative district with ease—perfect for fast, localized policy engagement.
  • Built for Dashboards & Speed: Whether you’re reporting to leadership or tracking market trends, CleanPowerIQ delivers data seamlessly with dashboards and quick data exports.
What kind of power projects does CleanPowerIQ track?

CleanPowerIQ tracks U.S. utility-scale solar, onshore wind, offshore wind, and battery storage projects. Utility-scale refers to projects that are front-of-the-meter and typically 1 MW or larger.

What is the source of the data?

ACP’s expert staff collects clean energy project information on a year-round basis from public and private sources. ACP validates all information before publishing in CleanPowerIQ or ACP Market Reports. Project details on operational clean power projects are validated and confirmed with industry contacts on a quarterly basis.  CleanPowerIQ also integrates data from external sources, such as the Energy Information Administration (EIA) and the Federal Aviation Administration (FAA).

What are the fees for CleanPowerIQ access?

CleanPowerIQ is included in ACP membership dues for Business tier members and above. Small Business members can purchase CleanPowerIQ access for $10,000/year, while non-members can apply to purchase CleanPowerIQ access for $20,000/year. Please contact [email protected] for more information.

CleanPowerIQ subscriptions are company-wide, giving all employees with a verified company email domain instant access to the full platform—no individual seat licenses required.

The annual subscription is calculated for a full calendar year. For example, if a subscription is purchased on September 15, it will be valid through September 14 the following year.

What is new in CleanPowerIQ?

The new CleanPowerIQ puts interactive data visualization at the heart of the user experience. While users can still download raw data in CSV format, the upgraded platform now features intuitive dashboards and dynamic maps that make it easy to explore insights instantly.

Quickly visualize project-level details or roll up views by congressional district, state, county, company, or technology– all within a click. Interactive maps bring the clean power landscape to life, offering a powerful new way to understand market trends and opportunities at every level.

CleanPowerIQ makes clean energy data not just accessible—but actionable.

How is CleanPowerIQ different than other clean power datasets?

CleanPowerIQ delivers verified, up-to-date insights you can trust—refreshed daily with input directly from project developers, owners, and buyers. Each data point is grounded in company confirmation and validated by ACP’s in-house analysts, who cross-reference a wide array of third-party sources to ensure accuracy and depth. Unlike platforms that rely solely on static public data like the Energy Information Administration (EIA), CleanPowerIQ reflects the real-time state of the market.

The platform also offers the industry’s most comprehensive view of clean power procurement—tracking not only power purchase agreements (PPAs) across commercial, industrial, and utility sectors, but also tolling agreements, resource adequacy contracts, green tariffs, and other emerging deal structures.

This is data built for decision-makers—accurate, current, and far more expansive than any other platform on the market.

How do I access CleanPowerIQ?

Enter the database here and provide your credentials to login to the platform. If you do not have a CleanPowerIQ subscription, on-screen prompts will direct you to the subscription page.

How often is CleanPowerIQ updated?

CleanPowerIQ is updated daily with new project details. ACP’s expert staff continuously monitors clean power industry activity and updates the database in real-time. At the end of the quarter, ACP performs a thorough validation, confirming quarterly activity with project owners, developers, equipment manufacturers, and offtakers. Contact [email protected] for more information.

How do I use CleanPowerIQ?

CleanPowerIQ users now have more options than ever to search for the data points they need.

Users can access a streamlined version of the previous main search page by clicking on “Data Search” in the side bar and then selecting “Project.” The “Project” tab is designed so the user can easily filter projects by status, project name, year online, location, owner, power offtaker, project size and other factors to quickly find the specific information of interest.

The Wind Turbine search is also available, as “Turbine” under “Data Search.”

CleanPowerIQ has 10 new dashboards that can more quickly locate and visualize the data points you’re looking for. These dashboards include:

  • Phase: Search a particular project phase by name and immediately see its capacity, state, legislative district (state and federal), location on a map, technology and model, ownership history, and power purchaser history.
  • Company: View a company’s owned and developed clean power assets at a glance, with this dashboard featuring both topline summaries and full lists of online and pipeline projects.
  • State: Search a specific state’s clean power landscape, including an interactive map of projects, clean power generation history, and a comprehensive summary of company presence, including project constructors, owners, developers, servicers, and power purchasers.
  • Congressional District: This dashboard view is perfect for those who work in advocacy – filter by congressional district and get a full summary of how many clean power projects are being built there, as well as use the “Company Presence” feature to quickly drill down into what companies are most invested in that district.
  • County: Great for local and state level advocacy work, as well as business development research, this dashboard features the county-level view of operational and pipeline clean power projects. Gain a comprehensive list of all projects in a particular county, as well as utilize the map feature to see where they are located and the company presence feature to discern which companies operate there. 
  • Three technology-specific dashboards – Onshore Wind, Solar, and Storage: These three dashboards give a comprehensive view of the state of each technology’s deployment activity in the United States, including the breakdown of OEM/models used, which states host the most capacity, and an interactive map of projects. Filter by project, project status, state, status year, owner, developer, or equipment manufacturer.
  • Market Activity: This dashboard shows the latest summary of operational capacity for utility-scale solar, onshore wind, offshore wind, and battery storage technologies. Charts include annual and cumulative capacity additions over time, a preliminary list of the top clean power developers and capacity owners, and a map of operational capacity by state. 
  • Development Activity: The clean power development pipeline has never been easier to parse with this dashboard: filter by state, project status, year, developer, or owner, and get immediate takeaways on who is building the next tranche of clean power projects and where.
Where does the generation data come from?

Generation data is sourced from the U.S. Energy Information Administration. Because the monthly data release is limited to a certain number of facilities, with more facilities covered in the annual data release, not all projects have recent generation data.

Can I share CleanPowerIQ?

No, CleanPowerIQ is meant for internal purposes only. The terms & conditions of database use are as follows:

© 2025 American Clean Power Association. All rights reserved. You may access, reproduce, and print the American Clean Power Association’s (“ACP”) CleanPowerIQ and its contents, and any portion thereof (the “Database”) for internal use only (which use may include internal use by employees and assignees of your company), and, by accessing the Database, you agree: (i) that you shall not sell or otherwise engage in any distribution of the Database; (ii) that you shall not make any alterations, modifications, deletions or other changes to the Database without the express written consent of ACP; and (iii) to indemnify and hold ACP harmless for any loss or damage, including reasonable attorney’s fees, which ACP may incur, directly or indirectly, as a result of your use of the Database.  The names, trademarks, service marks and logos of ACP appearing in the Materials may not be used in any advertising or publicity, or otherwise, to indicate ACP’s sponsorship or affiliation, without ACP’s prior express written permission.  All the other product and company names mentioned in the Materials may be the trademarks or registered trademarks of their respective owners.

Get news, policy updates, and data on the evolving clean energy landscape.

Methodology

ACP CPIQ Methodology

CleanPowerIQ is a database of U.S. clean power projects maintained by ACP’s in-house market intelligence team. Analysts monitor project developments and make updates to the database daily, along with a quarterly data validation process.

The quarterly data validation process features direct outreach to project developers, owners, equipment manufacturers, and clean energy buyers, with information cross-referenced with press releases, news, and data from the EIA, ISOs/RTOs, and third-party market watchers. ACP prioritizes direct confirmation from companies, but in the absence of direct confirmation, will defer to the EIA 860-M dataset and credible news sources.

Project tracking begins at the advanced development stage (definition below).

CleanPowerIQ uses ACP’s official definitions to determine project status.

ACP project status definitions:

Advanced Development: Projects not under construction, but with a PPA, firm equipment order, or moving forward with plans to be placed under utility ownership as of the end of the most recent quarter. For offshore wind, advanced development consists of projects that have secured offtake or have had successful bids in response to a state solicitation even if final offtake negotiations have not concluded.

Under construction: Construction team has begun work on the ground at the project site. For offshore wind, under construction is defined as in-ocean construction.

Online: Project has reached commercial operation and is delivering electricity to the ultimate point of delivery.

Decommissioned: Project is offline and is no longer delivering power to the grid on a permanent basis. Physical removal of equipment is not a requirement.

Other ACP definitions:

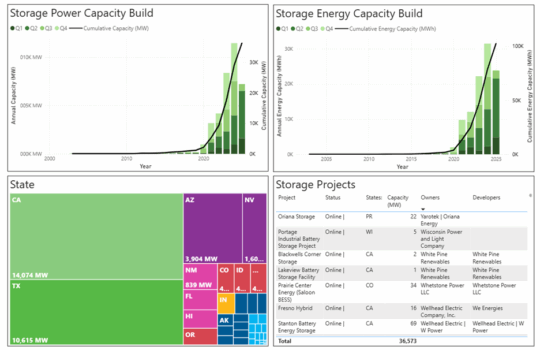
Capacity: Project nameplate capacity. Unless otherwise stated, ACP reports capacity in MW-ac.

Duration: The amount of time, in hours, a battery can discharge its power capacity before depleting its energy capacity. For example, a 2 MW battery that has 4 MWh of energy capacity has a duration of 2 hours.

Full repowering: Full decommissioning of a utility-scale project. The original equipment is physically removed from the project site and replaced with new utility-scale equipment.

Inverter Loading Ratio (ILR): The ratio of installed DC capacity to the inverter’s AC power rating. Also known as the DC-to-AC ratio.

Partial repowering, nacelle replacement: Complete replacement of a utility-scale wind turbine’s nacelle, rotor, and blades. The tower and foundation are retained.

Partial repowering, major retrofit: Complete replacement of a utility-scale wind turbine’s rotor and blades, along with the replacement of at least one major component within the nacelle, typically the gearbox or the generator.

Pipeline: Projects either under construction or in advanced development.

Repowered: Full or partial equipment replacement. Currently only wind repowering activity is tracked, but ACP will expand repowering activity tracked as the market progresses.