You must be a member to access this resource.
to learn more, or contact our membership team at or (202) 383-2500 to discuss becoming an ACP member.
Q4 2022 Shows Positive Energy Storage Growth, But Policy and Market Headwinds Slow Clean Energy Potential
Overview
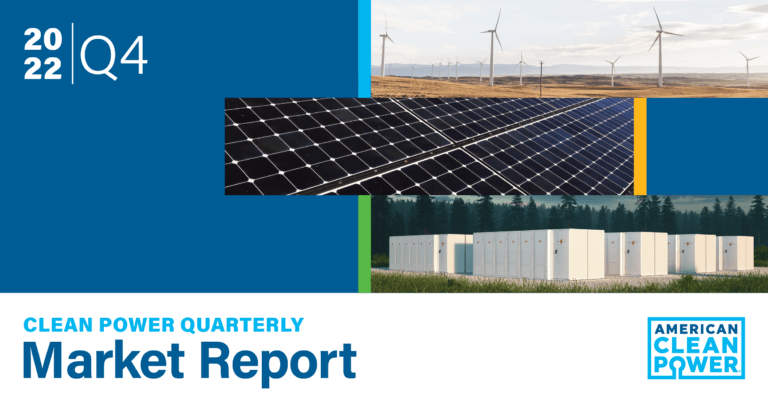
In the fourth quarter of 2022, the U.S. wind, solar, and battery storage sectors installed a total of 9.6 gigawatts (GW) of utility-scale clean power capacity – enough to power the equivalent of 2 million American homes with affordable, domestic energy, according to the Q4 2022 Clean Power Quarterly Market Report.
While Q4 was the best quarter of 2022, it was the lowest fourth quarter for utility-scale clean energy project installations since 2019. A confluence of policy and market headwinds such as supply chain constraints, lengthy delays connecting projects to the grid, unclear trade restrictions, longstanding permitting obstacles and uncertainty over IRA implementation slowed project development in 2022. While ACP members have worked with federal, state and local officials to get over 25 GW of new clean power online, this progress fell short of industry and analyst projections.
For the full year, the industry installed 25.1 GW of clean power capacity across the United States, representing a $35 billion capital investment. 2022 installations mark a 16% decline from the record year in 2021 and a 12% decline from 2020.
Battery storage set a record for annual installations in 2022, commissioning 4 GW/12.2 GWh of new capacity. Solar led annual installs with 12.6 GW coming online. Land-based wind finished the year with it’s strongest quarter, but annual installs were still the lowest since 2018.
Want to learn more?
Our Clean Power Quarterly provides a snapshot view of the latest U.S. utility wind, solar, and battery storage industry activity and trends. The report includes fourth quarter installations, projects under construction and in advanced development, new power purchase agreements, OEM market share, project acquisition activity, offshore wind energy activity, and much, much more.
The full report is available to members only. Not a member? Join now.
The free public version of the report, which provides a summary of key takeaways and graphics from the full report, is available for download below.
Interested in the data behind the report? Members can download the appendices here and check out the underlying data in spreadsheet form here.

