Our newest market report details the latest U.S. wind industry, utility-scale solar, and energy storage activity and trends.

The report includes:

  • new wind capacity installations in 2020
  • wind projects under construction and in advanced development
  • new power purchase agreements
  • turbine OEM market share
  • project acquisition activity
  • offshore wind energy activity

For the first time, the report also includes data on utility-scale solar and energy storage.

The public version of the report provides a summary of key takeaways and graphics from the full report, which is available for ACP members.  ACP’s future quarterly reports will include the association’s own data on utility-scale solar and energy storage, along with wind.

Fourth quarter highlights include

Key Findings

2020 Wind Project Installations

  • The U.S. wind industry installed 10,593 MW of new wind power capacity in the fourth quarter of 2020, the highest quarter on record. In fact, more wind was installed at the end of 2020, then any other year except
    2012.
  • 2020 was a banner year for the wind industry. Developers commissioned 16,913 MW, representing an 85 percent increase over 2019.
  • Project owners commissioned 54 new projects across 20 states in the fourth quarter. Texas led with 2,197 MW installed, followed by Wyoming (895 MW), Oklahoma (866), Iowa (861 MW), and Missouri (786
    MW).
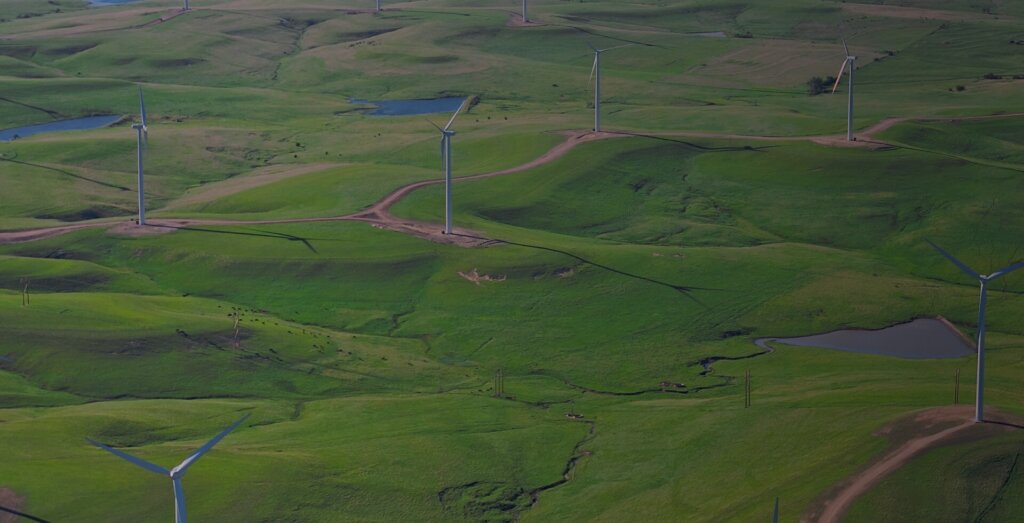
  • There are now 122,468 MW of operating wind power capacity in the United States, with over 60,000 wind turbines operating across 41 states and two U.S. territories.

Wind Capacity Under Construction and in Advanced Development

  • Projects totaling 34,757 MW were under construction (17,302 MW) or in advanced development (17,455 MW) at the end of December.
  • Projects totaling 3,334 MW started construction in the fourth quarter and 500 MW entered advanced development.
  • There are currently 10 states with over 1,000 MW in the near-term pipeline. Federal waters host 26% of the total development pipeline, followed by Texas (13%), Wyoming (10%), Oklahoma (7%), and Kansas (5%).

Wind Power Procurement Activity

  • Project developers and power purchasers reported 700 MW of new PPAs in the fourth quarter, bringing PPA activity for the year to 5,444 MW.
  • Corporate PPA activity declined this quarter, with only one announcement of 200 MW.

Turbine Technology Trends

  • GE Renewable Energy led turbine installations in 2020, capturing 53% of the market through December.
  • Vestas ranks second with 35%, followed by Siemens Gamesa Renewable Energy with 10% and Nordex USA with 3%.
  • Project owners completed 2,899 MW of partial repowerings in 2020. GE Renewable Energy led this market segment as well, repowering 2,086 MW. Vestas repowered 774 MW and Siemens Gamesa repowered 39 MW in the year.
Become a Member

Elevate Your Business with Insider Access:

  • Policy Direction: Your voice in critical industry discussions.
  • Exclusive Networking: Learn directly from key players in clean energy.
  • Insider Information: First-hand access to policy insights and premier events.
  • Advanced Tools: Our proprietary data at your fingertips to drive growth.

Act now to become a defining part of clean energy’s future.

Stay informed

Take Action

Subscribe to American Clean Power and receive the latest clean energy news, policy updates, and opportunities to get involved.