Wind’s 2020 Market Results Breeze Through the Record Books
Hot on the heels of American Clean Power’s July release of its first Clean Power Annual 2020 Report which showed record level deployments of wind, solar and energy storage across the country, the U.S. Department of Energy (DOE) is out with its annual trio of wind energy reports. Released last month, DOE’s land-based and offshore wind market reports highlight the record growth and other encouraging findings for the wind energy sector in 2020.
While the report covers a range of interesting data and trends, here are the notable utility scale wind generation highlights that you need to know from two of the three reports: the Land-Based Wind Market Report and the Offshore Wind Market Report.
The flagship of DOE’s wind market reports is the 2021 Land-Based Wind Market Report, which is prepared by the Lawrence Berkeley National Laboratory and leverages ACP data. The report’s key findings include:
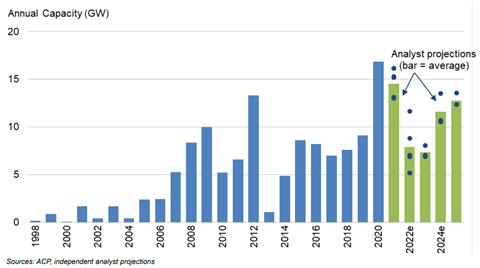
- A record 16,836 megawatts (MW) of new utility-scale land-based wind power capacity added in 2020 – representing $24.6 billion of investment in new wind power projects
- More wind energy was installed in 2020 in the U.S. than any other energy source, accounting for 42% of new U.S. power generating capacity. Over the last decade, wind has comprised 29% of total capacity additions.
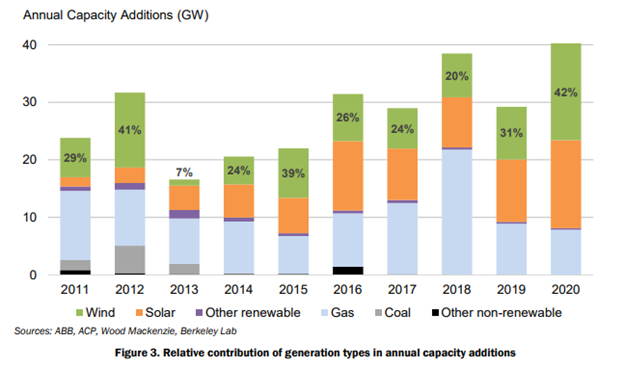
Source: U.S. Department of Energy’s Land-Based Wind Market Report: 2021 Edition
- New utility-scale land-based wind turbines were installed in 25 states in 2020. Texas installed the most capacity with 4,137 MW. Iowa, Oklahoma, Wyoming, Illinois, and Missouri all added more than 1,000 MW of capacity in 2020.
- Wind turbine prices have steeply declined from levels seen a decade ago, from $1,800/kW in 2008 to $770–$850 per kilowatt (kW) now. Lower turbine prices have driven reductions in total installed project costs: around $1,460/kW average in 2020.
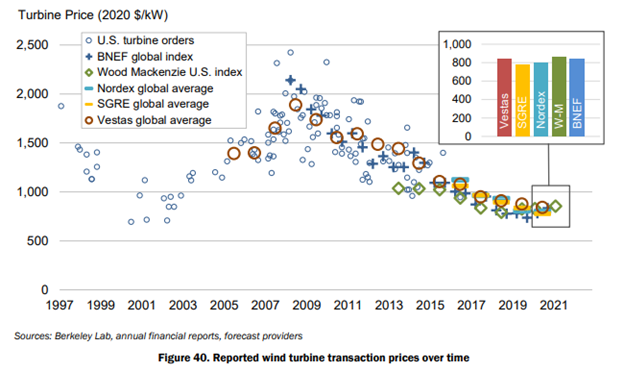
Source: U.S. Department of Energy’s Land-Based Wind Market Report: 2021 Edition
- The average capacity factor in 2020 exceeded 40% among wind projects built in recent years, and reached 36% on a fleet-wide basis
- The average nameplate capacity of newly installed wind turbines grew 8% from 2019 to 2.75 MW.
- 209 GW of wind power capacity exists in transmission interconnection queues (typically only around 25% will reach completion)
- Interest in hybrid plants has increased: By the end of 2020 there were 38 hybrid wind power plants in operation representing 2.3 GW of wind power and 0.9 GW of co-located resources (mostly solar or energy storage). In the interconnection queues 6% of wind is proposed as hybrids (13 GW); 34% of solar proposed as hybrids (159 GW).
- Average Power Purchase Agreement prices have steeply declined since 2009; prices below $20/MWh in central region but have been flat or risen in recent years. Recent wind power purchase agreements are priced in the mid-teens in some cases.
- Levelized cost of wind energy (LCOE) has generally declined: nationwide average of $33/MWh for projects installed in 2020.
- Independent analysts anticipate sizable wind additions in 2021 given tax incentives, but with a possible short-term downturn in 2022–2023
Offshore wind power is America’s next major source of clean energy and will play a leading role in the transition to carbon-free energy sources. As offshore wind takes hold in the U.S., this burgeoning industry could create over 83,000 new jobs by 2030, establish an entirely new supply chain, and provide critical investment to communities across the country. The key findings of the 2021 edition of the Offshore Wind Market Report, prepared by DOE’s National Renewable Energy Laboratory, include:
- The pipeline for U.S. offshore wind energy projects grew to 35,324 MW, a 24% increase over the previous year.
- One project – the 800 MW Vineyard Wind 1 – is fully approved, has received all permits, an offtake contract to sell the power, and an interconnection agreement to deliver it to the grid. In addition, there are 15 projects in the pipeline that have reached the permitting phase, with either a Construction and Operations Plan or an offtake mechanism for the sale of electricity.
- Massachusetts, North Carolina, and Virginia all increased offshore wind procurement targets in 2020 and early 2021. In total, state goals grew by 15,600 MW, from about 24,000 MW by 2035 in 2019 to almost 40,000 MW by 2040.
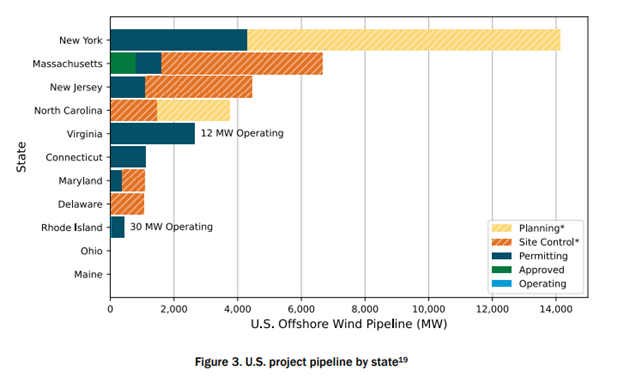
Source: U.S. Department of Energy’s Offshore Wind Market Report: 2021 Edition
- The Bureau of Ocean Management created five new wind energy areas in the New York Bight with a total of 9,800 MW of capacity, representing most of the 2020-2021 growth of the U.S. pipeline.
- Globally, the offshore wind energy industry installed 5,519 MW of capacity in 2020. Much of the added global generating capacity can be attributed to 2,174 MW of new deployments in the Chinese market, followed by 1,503 MW commissioned in the Netherlands, 714 MW in the United Kingdom, 706 MW in Belgium, 315 MW in Germany, and 107 MW divided among the rest of the world.
- No new floating offshore wind was added in 2020 but the development pipeline tripled from 7,663 MW in 2019 to 26,529 MW in 2020, representing 18,866 MW of growth since the previous 2019 DOE offshore wind report. This growth is attributed to several projects beginning their planning phase during 2020, especially in Asian markets.
- Globally, the average LCOE of fixed-bottom offshore wind energy installations is now below $95 MWh. LCOE for wind projects that have a commercial operations date in 2020 range between $78/MWh and $125/MWh. Offshore wind LCOE has declined by 28%-51% between 2014 and 2020. Floating offshore wind LCOE is predicted to decline from approximately $160/MWh in 2020 to $60‒$105/MWh in 2030.
- The levelized procurement price of U.S. offshore wind energy projects ranges between $96/MWh (Vineyard Wind 1) and $71/MWh (Mayflower Wind) for projects commencing commercial operations between 2022 and 2025. These prices from power purchase agreements and offshore renewable energy certificates are based on a total of 5.5 GW of signed agreements.
2020 marked a banner year for wind in America, and with continued industry momentum and supportive clean energy infrastructure and stable tax policies in place, land-based and offshore wind with grow as one of the country’s leading energy sources. Accelerated action and work currently underway in Congress to invest in clean energy will deploy more projects, create more American jobs, and drive more economic benefits to communities across America as we all work toward a renewable energy and lower carbon future.
Historical and forecasted land-based wind capacity additions
