Clean Energy Powers America

2024

Explore the Annual Report

Highlights from ACP’s Market Report 2024

American clean power saw nearly $80 billion in investment and supported 1.4 million jobs in 2024.

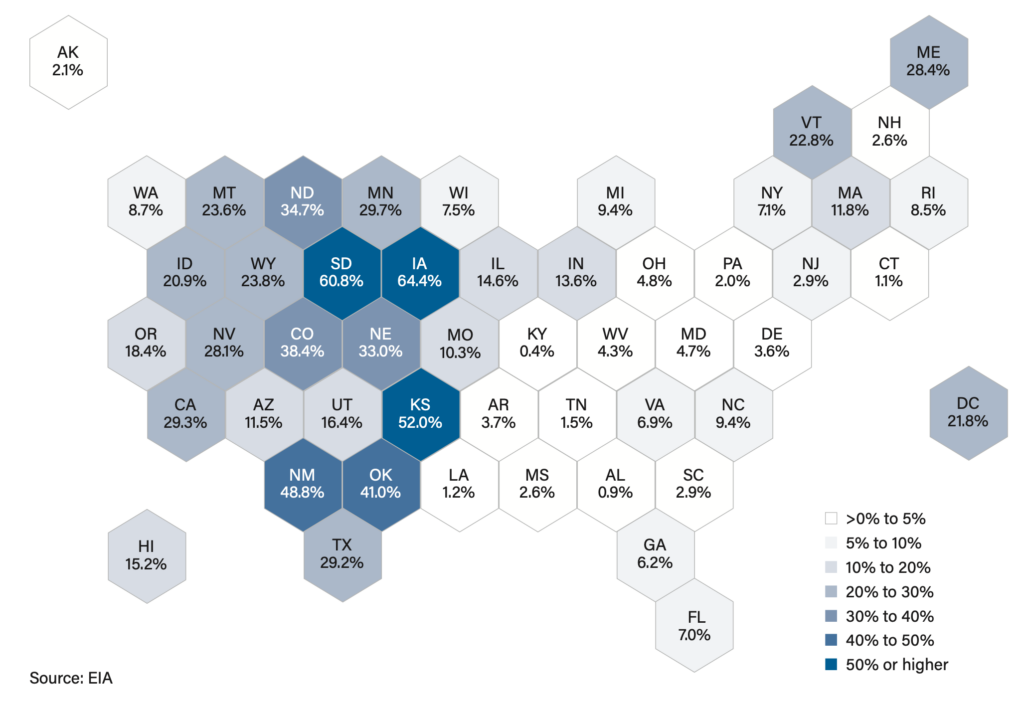
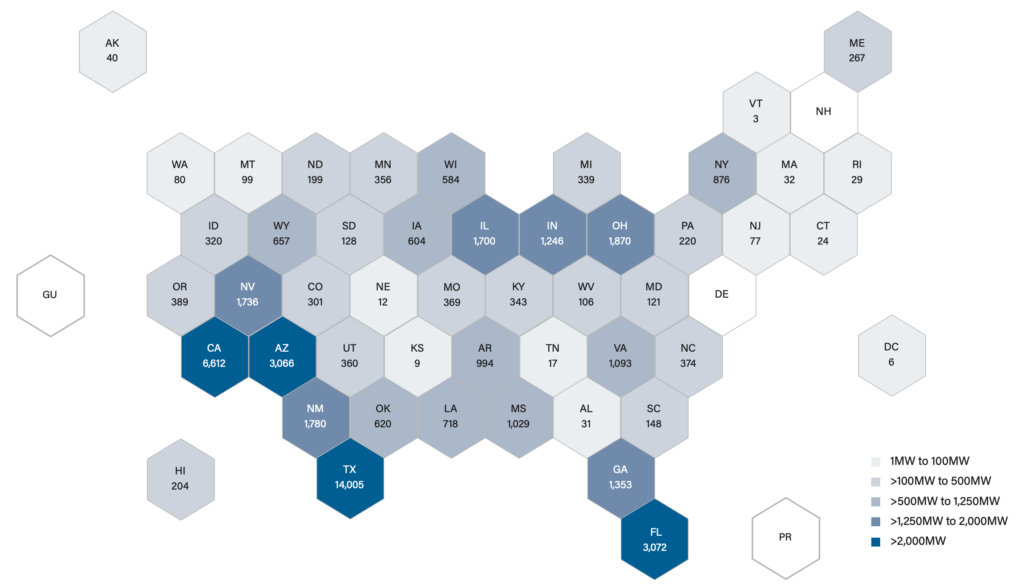
The clean power industry continued its steady expansion in 2024, delivering 49 gigawatts of new capacity—representing a 33% increase from 2023. This growth brought America’s total clean energy fleet to 313 GW with projects now operating in all 50 states. Clean power accounted for 93% of all new electricity capacity added to the grid last year. In a notable market development, 2024 marked the first time utility-scale solar and wind generation exceeded coal output, together providing nearly 16% of U.S. electricity.

This isn’t politics—it’s economics.

The markets have spoken: Fortune 500 giants including Amazon, Microsoft, Meta, and Google contracted 11 GW of clean power in 2024 alone—nearly matching Florida’s entire clean energy fleet. These companies are choosing clean energy for its competitive economics, reliability when paired with storage, and rapid deployment capabilities.

Manufacturing Renaissance

45 new or expanded manufacturing facilities came online in 2024, representing more than $9 billion in investment. This domestic supply chain growth is creating skilled, long-term jobs in industrial communities, reducing dependence on imported components, and strengthening American energy security. Many of these facilities are revitalizing former industrial sites and bringing new economic activity to regions that have experienced manufacturing decline.

Community Benefits

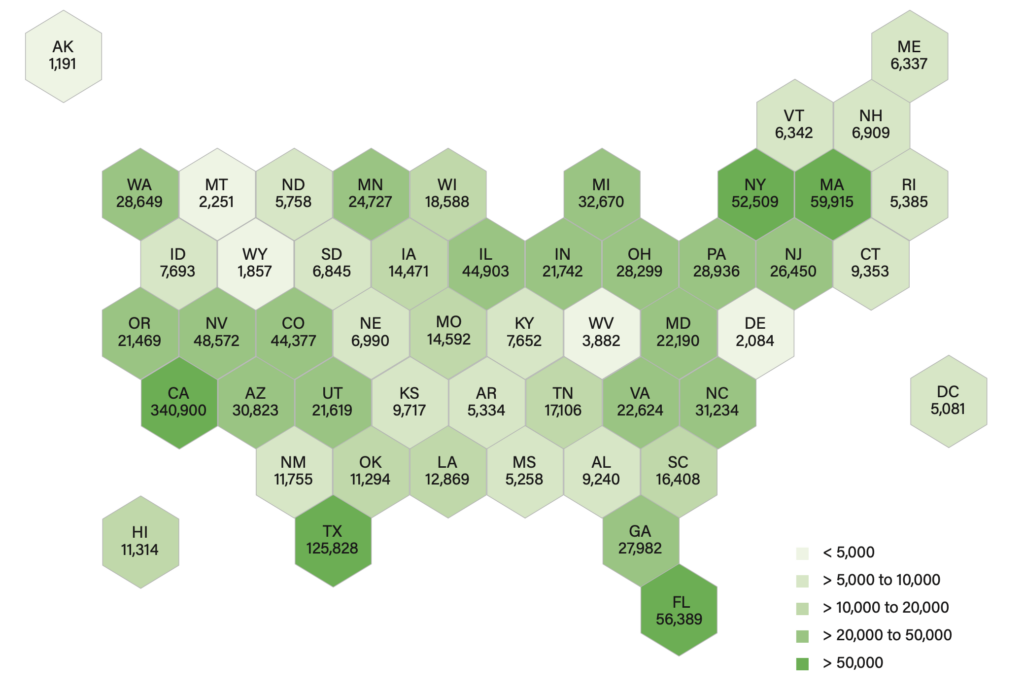
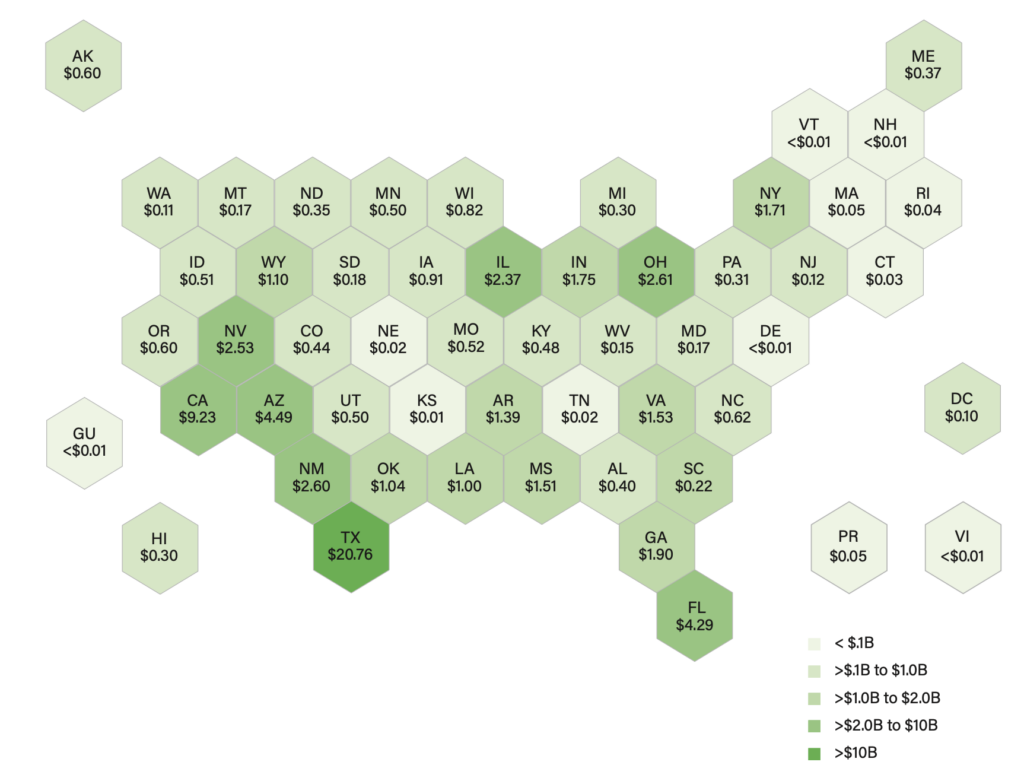
Wind and solar installations delivered around $4 billion in state and local tax payments and land-lease payments to rural communities in 2024 alone. These funds directly support local schools, roads, and essential services. In numerous rural counties, renewable energy projects have become significant contributors to the local tax base, providing stable revenue streams to communities.

Future Growth & Economic Return

With 174 GW in advanced development and representing 95% of the interconnection queue, clean energy is positioned to meet projected electricity demand growth of up to 50% by 2040. Analysis shows current energy tax credits deliver strong returns—driving $1.9 trillion in economic growth, creating 13.7 million jobs, and generating a 4x return on federal investment by 2035.

Clean energy continues to strengthen America’s energy security and economic prosperity across both Republican and Democratic districts alike.

Download the Report


👇 Scroll down for data from ACP’s new Clean Power Annual Market Report | 2024.

Clean Power Installations

Read the article
The US added a record 48.7 GW of clean power, up 33% from 2023

The US added a record-setting 48.7 GW of clean power to the grid in 2024, up 33% from the previous record set in 2023. 

Solar installations surged to 33.3 GW, while battery storage saw its first double-digit year with 11.3 GW installed. The offshore wind industry also commissioned South Fork Wind, the largest U.S. offshore wind project to date at 132 MW. 


Twenty states generated more than 16% of their electricity from wind and utility-scale solar, while 26 states generated at least 10% from these clean power resources. 

Clean Energy Jobs

Read the article
US utility-scale clean power industry supports 1.4 million jobs

The U.S. utility-scale clean power industry directly employs 460,000 Americans in manufacturing, construction, project development, maintenance, and operations roles.

The industry’s economic ripple effect creates another 309,000 jobs indirectly supported through the supply chain—people who provide materials, equipment, and services the industry relies on— and an additional 630,000 induced jobs—like teachers, restaurant staff, healthcare workers, and others whose work is supported by the money flowing into local communities. 

For every worker directly employed in clean power, the industry supports 0.7 jobs in upstream (supply chain) activities and 1.4 jobs resulting from additional economic activity driven by spending from wages earned by workers. 


Hex map of Clean Energy Jobs by State in 2024 in the US

California leads with 341,000 clean energy jobs, followed by Texas with 126,000 jobs. Nevada has the highest concentration of clean energy jobs relative to population at 1.49%. 

Investing in America

Read the article
$70 billion invested in American clean energy projects in 2024

The clean power industry invested a record $70 billion in new projects in 2024. That’s more annual investment than the entire U.S. auto industry typically makes in factories and equipment each year. 

Solar led with $46 billion (up 53% year-over-year), while battery storage investment grew 31% to $17 billion. 

American clean power investments generate around $4 billion annually in state and local taxes and land lease payment revenues, directly benefitting the communities around them. 

Cumulatively, the industry has invested over $600 billion in clean power.  


Hex map of the US showing Capital Investment by State in 2024

Texas attracted the highest investment at over $20 billion, followed by California ($9 billion) and Arizona ($4.5 billion). Relative to economic size, Wyoming, New Mexico, Nevada, and Mississippi saw the highest investment intensity. 

Clean Energy Manufacturing

Read the article
45 new facilities strengthen domestic supply chains

The industry commissioned 45 new or expanded manufacturing facilities in 2024—with 84% located in red states. There are now 193 primary manufacturing plants serving the clean power industry nationwide. 

This manufacturing renaissance has accelerated dramatically since the passage of federal energy tax credits, with planned manufacturing facilities and expansions more than doubling. 

The U.S. has 186 additional clean power manufacturing facilities in the pipeline, representing investments exceeding $136 billion and poised to create over 91,000 direct manufacturing jobs. 

Total construction spending has almost tripled in the U.S. since 2020 and more than six times what it was 20 years ago. Clean energy manufacturing has boomed in unison with economy-wide construction spending since the passage of US infrastructure legislation. 

States' Role in Clean Energy Growth

Read the article
48 states installed at least one utility-scale clean energy project in 2024


Hex map of the US displaying Clean Power Capacity Installed in 2024 (MW)

In 2024, 48 out of 50 U.S. states installed at least one utility-scale solar, wind, or storage project. Texas installed more capacity than the next three states combined. 

Mississippi, Arkansas, and Louisiana joined the list of top states for clean power additions, each adding more than 700 MW. Kentucky multiplied its solar fleet five-fold, while Louisiana tripled its operational solar capacity. These economic decisions show how market forces are driving clean energy adoption nationwide. 

Clean Power Capacity by US Congressional District

Republican-held congressional districts were home to 77% of clean power capacity installed in 2024, with 79% of the operational U.S. clean power fleet located in GOP districts. 

Corporate Purchases of Clean Energy

Read the article
Corporate buyers represent 25% share of operating clean power capacity

Power purchase agreement (PPA) announcements increased 56% in 2024, reaching 42.4 GW. Corporate buyers helped drive this growth, accounting for 39% of all new PPAs. 

Commercial & industrial purchasers have expanded their share of operating clean power, becoming the second largest purchaser group for clean power procurement, going from procuring 0% of operational capacity in 2000 to 25% in 2024. 

Companies are increasingly turning to clean power to secure price stability, enhance reliability, and meet sustainability goals while maintaining competitiveness. As data centers and manufacturing facilities drive unprecedented electricity demand growth, clean energy offers fast deployment timelines and predictable long-term costs. 

Top 10 Commercial & Industrial Purchasers of Clean Power

Amazon, Microsoft, Meta, and Google collectively contracted 11.3 GW of clean power in 2024—nearly matching the total clean power capacity installed across Florida, the nation’s fifth-largest clean power state. 

Looking for More?

Become an ACP member to access the full 160-page annual market report and more business insights.

An American Clean Power membership unlocks access to exclusive market intelligence resources, such as this annual market report. The free public version of the report, which provides a summary of key takeaways and graphics from the full report, isavailable for download.

However, the full Clean Power Annual Market Report | 2024, containing in-depth analysis of trends across the U.S. clean energy sectors, is available for members only. Not a member? Join now.