Clean Energy Powers America

2023

Explore the Annual Report

Data Highlights from ACP’s Annual Market Report

2023 Marked Record Year for U.S. Clean Power Installations
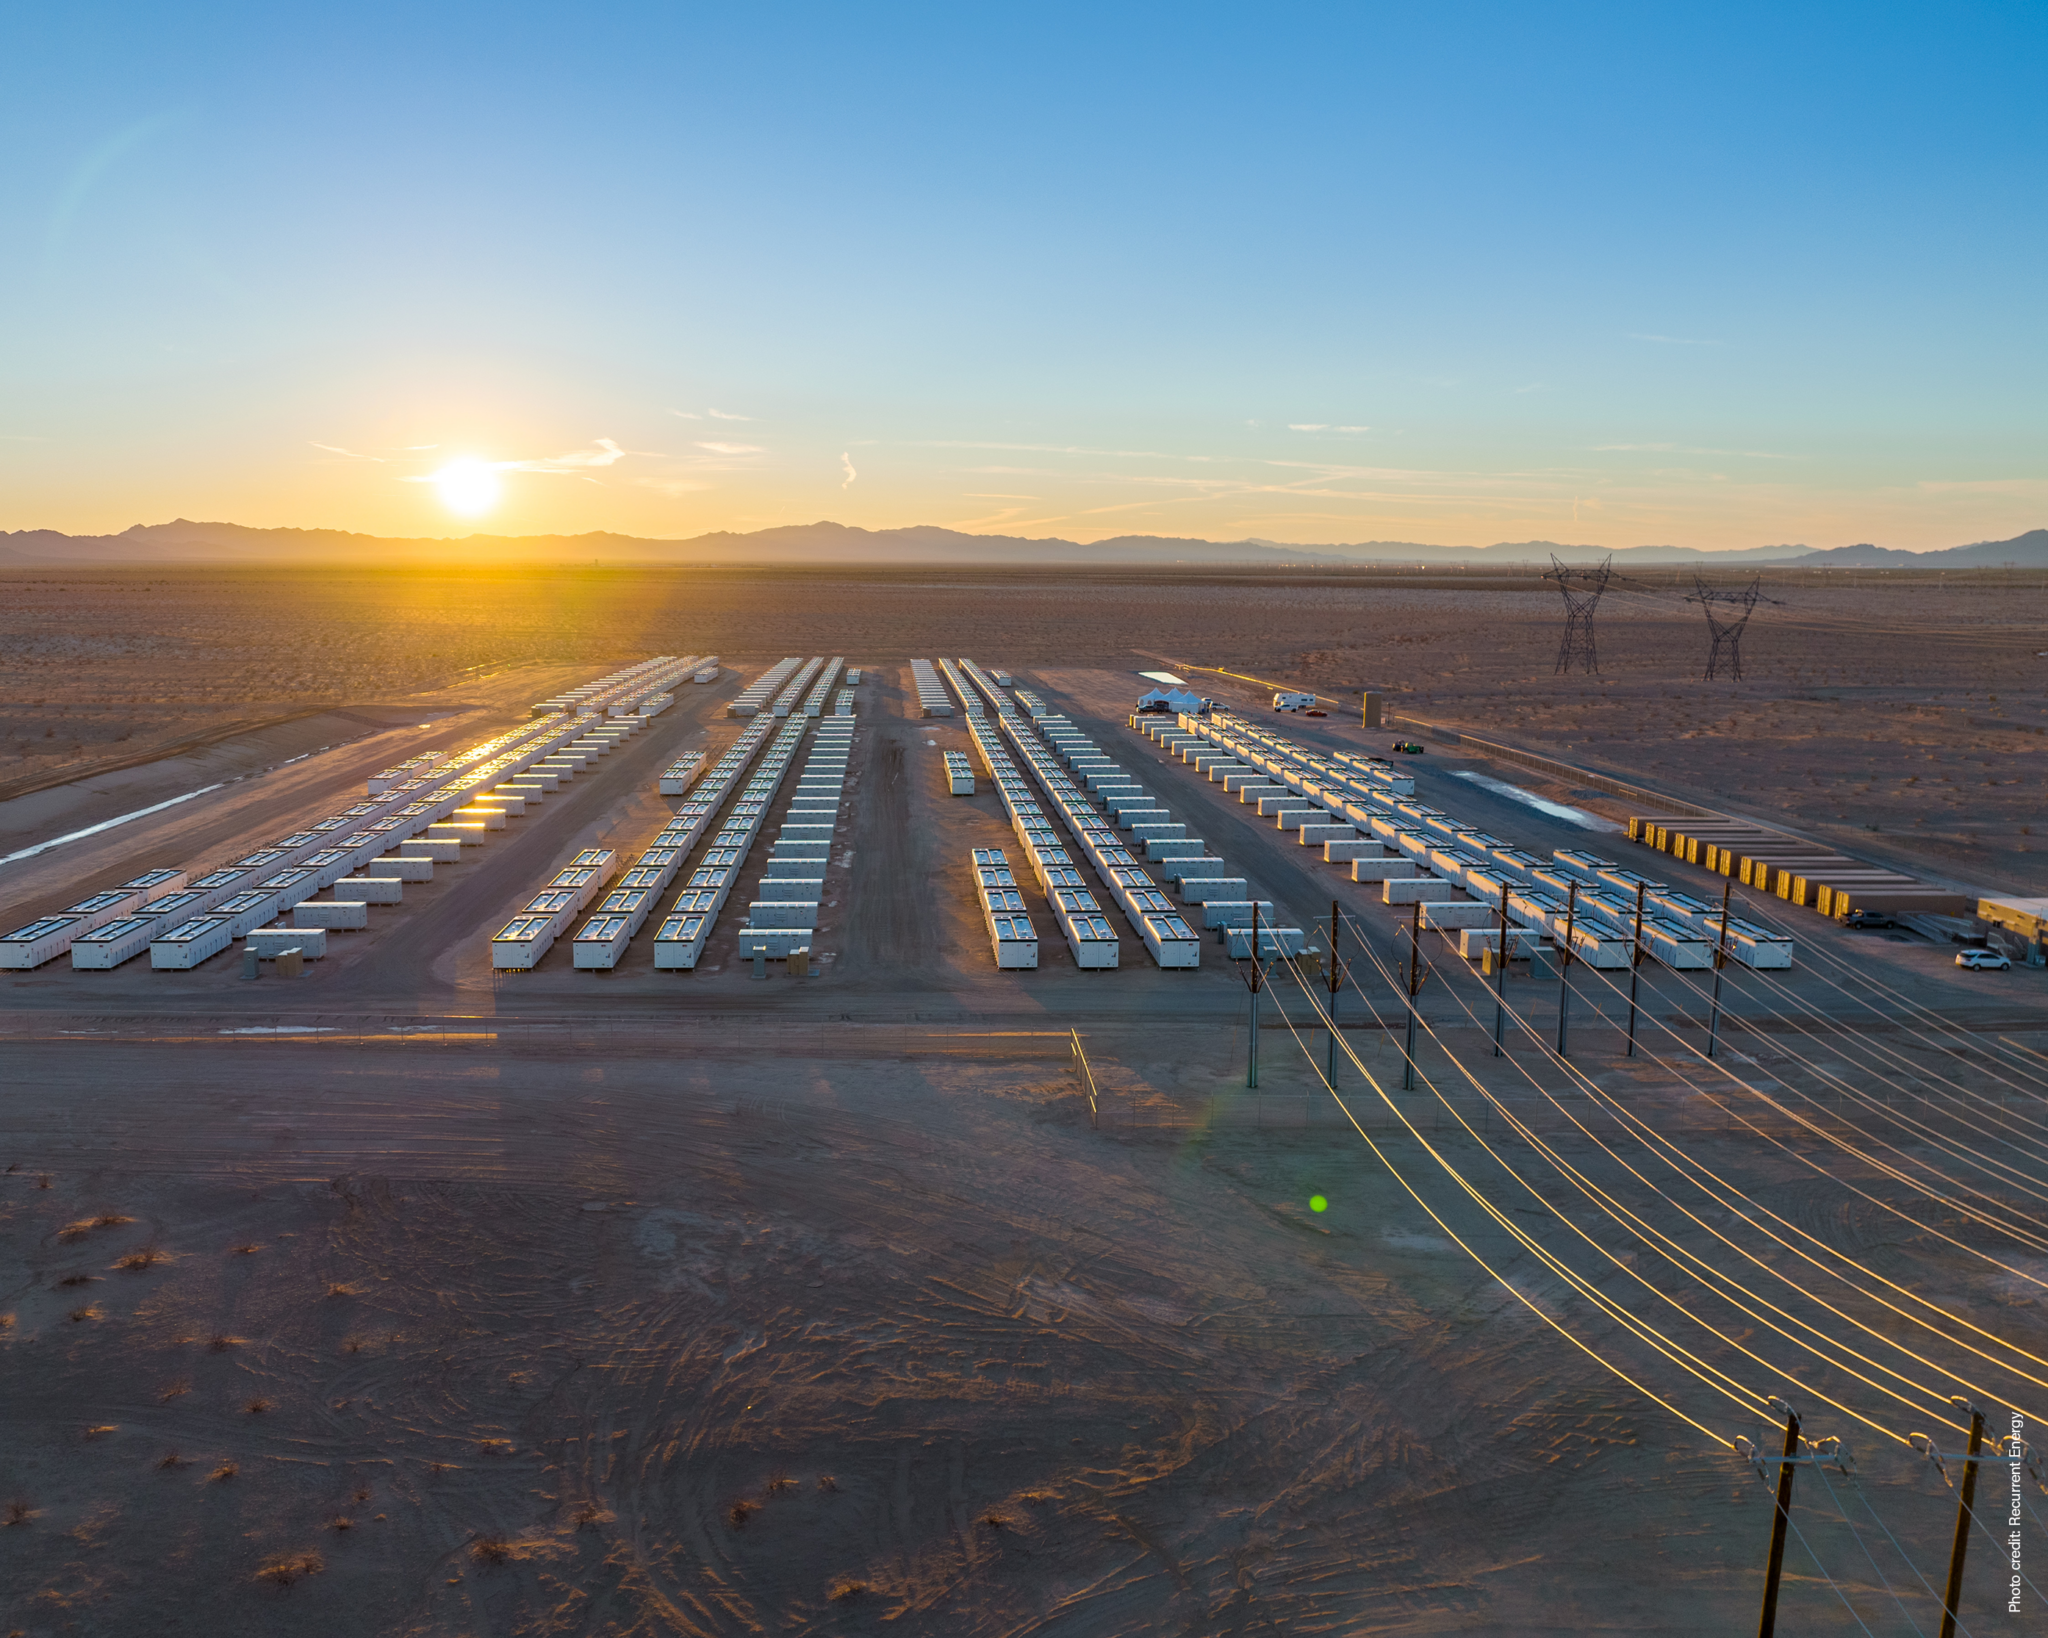
Solar and Storage Drive Growth

2023 was a dazzling year for the clean power industry, setting a record for the most clean energy installed in a single year, with 33.8 gigawatts (GW) installed. By the end of the year, wind, solar, and storage provided 262 GW of domestic clean energy. This is more than double the amount of clean power in operation in 2018, and represents nearly 16% of the country’s electricity. Clean power represented 77% of all new electricity capacity added in 2023.

Tremendous growth in solar and storage capacity accounted for most of the gains, with solar developers bringing nearly 20 GW of new projects online and the storage sector increasing by nearly 8 GW. On the other hand, the land-based and offshore wind sectors faced challenges in 2023, delivering just 6.4 GW of wind power capacity.

The clean power industry remains optimistic for the future, especially as developers started construction on 41 GW of new projects in the final months of 2023. This brings the clean power pipeline to a record 170 GW. Nonetheless, the record-setting pace of annual installations still lags behind what is needed for the country to achieve a net-zero emissions economy by 2050.  

To better understand the accomplishments and challenges of the clean power industry in 2023, interact with the topline data from ACP’s new Clean Power Annual Market Report below. For in-depth analysis of the total U.S. clean energy market, download the full 122-page members-only report.

Annual Installations

Read the article
Explore the data

2023 was the strongest year on record for combined U.S. utility-scale solar, wind, and energy storage installations, with 33.8 GW of clean energy installed.

The total amount of clean energy capacity in the U.S. now sits at nearly 262 GW, more than double the amount of clean power in operation in 2018. While wind projects still provide the bulk of all clean power capacity in operation at 58%, tremendous gains in solar and storage capacity over the last three years have reduced that majority.

Solar and storage both set new records for annual installations in 2023, with developers adding nearly 20 GW of new solar and almost 8 GW of new storage. Land-based wind installations fell to the lowest level in nearly a decade, at just 6.4 GW.

Cumulative Clean Power Capacity

Read the article
Explore the data

The clean power industry installed new capacity in 46 states in 2023. Texas alone installed nearly 10 GW of new capacity, expanding its lead over other states for total operational capacity. California installed 5.6 GW of new clean power capacity, with new projects almost entirely consisting of storage and solar.

Beyond Texas and California, five additional states added more than 1 GW of new clean power in 2023: Arizona, Florida, Colorado, Illinois, and Ohio.

Clean Power Share of U.S. Electricity Generation

Read the article
Explore the data

Two decades ago, less than 0.5% of U.S. electricity came from clean power. It took another five years to pass the 1% mark and growth continued at about 0.5% per year.

Starting in 2016, this growth rate accelerated.

By 2023, 15.9% of U.S electricity came from zero-emission wind and solar power, coming within throwing distance of surpassing coal generation for the first time. In 2023, coal generation totaled 16.2% of total generation, down 19% from 2022 levels after nearly 10 GW of coal-fired generation retirements.

The remainder of electricity in 2023 was generated by natural gas (43.1%), nuclear (18%), hydropower (5.7%), and other sources (1.1%).

Rush of New Manufacturing Activity

Read the article
Explore the data

By the end of 2023, more than 500 clean power manufacturing facilities were in operation nationwide.

From August 16, 2022, through February 2024, ACP has tracked 123 new, expanded, or reopened manufacturing announcements, representing over $35 billion in capital investment and nearly 42,000 new manufacturing jobs.

Clean Power Development Pipeline

Read the article
Explore the data

After historic clean energy incentives were signed into law in August 2022, clean power has seen record levels of announced activity, with the development pipeline surging to over 170 GW by the end of 2023 – 26% above where it was at the same point last year.

Solar accounted for 55% of clean power under development, followed by battery storage at 18%, land-based wind at 16%, and offshore wind at 11%. The solar pipeline saw the most growth by volume, adding 14.2 GW, but the battery storage pipeline saw the most growth by percentage, increasing 80% year-over-year.

Looking for more?

Become an ACP member to gain access to the full 122-page annual market report and more business insights.

An American Clean Power membership unlocks access to exclusive resources such as this report. The free public version of the report, which provides a summary of key takeaways and graphics from the full report, is available for download.

However, the full Clean Power Annual Market Report | 2023, containing in-depth analysis of trends across the U.S. clean energy sectors, is available for members only. Not a member? Join now.