Clean Energy Powers America

2022

Explore the Annual Report

Data Highlights from ACP’s Annual Market Report

2022 Marked Third-Highest Year for U.S. Utility-Scale Solar, Wind, and Storage Installations
But Growth Fell Short of Expectations

The clean energy revolution is underway. 2022 was the third-largest year for clean energy deployment on record, with 25.5 gigawatts (GW) installed. As these projects came online, Congress made unprecedented investments to modernize our energy systems, bringing the potential to more than triple the annual installations of wind, solar, and energy storage facilities by the end of the decade. 

However, a decline in deployment volume from the previous two years underscored the continued headwinds facing the industry. Supply chain constraints, lengthy delays connecting projects to the grid, unclear trade restrictions, longstanding permitting obstacles, and uncertainty over IRA implementation hindered project development and investment activity.

To better understand the accomplishments and challenges of the clean power industry in 2022, interact with the topline data from ACP’s new Clean Power Annual Market Report below. For in-depth analysis of the total U.S. clean energy market, download the full 180-page members-only report.

Clean Power at a Glance

Read the article

Annual Installations

2022 was the third-highest year for U.S. utility-scale solar, wind, and energy storage installations so far, with 25.5 GW of clean energy installed

But despite years of steady growth, 2022 saw the first decline in pace in five years – a 15% drop in clean power installations from the previous year.  

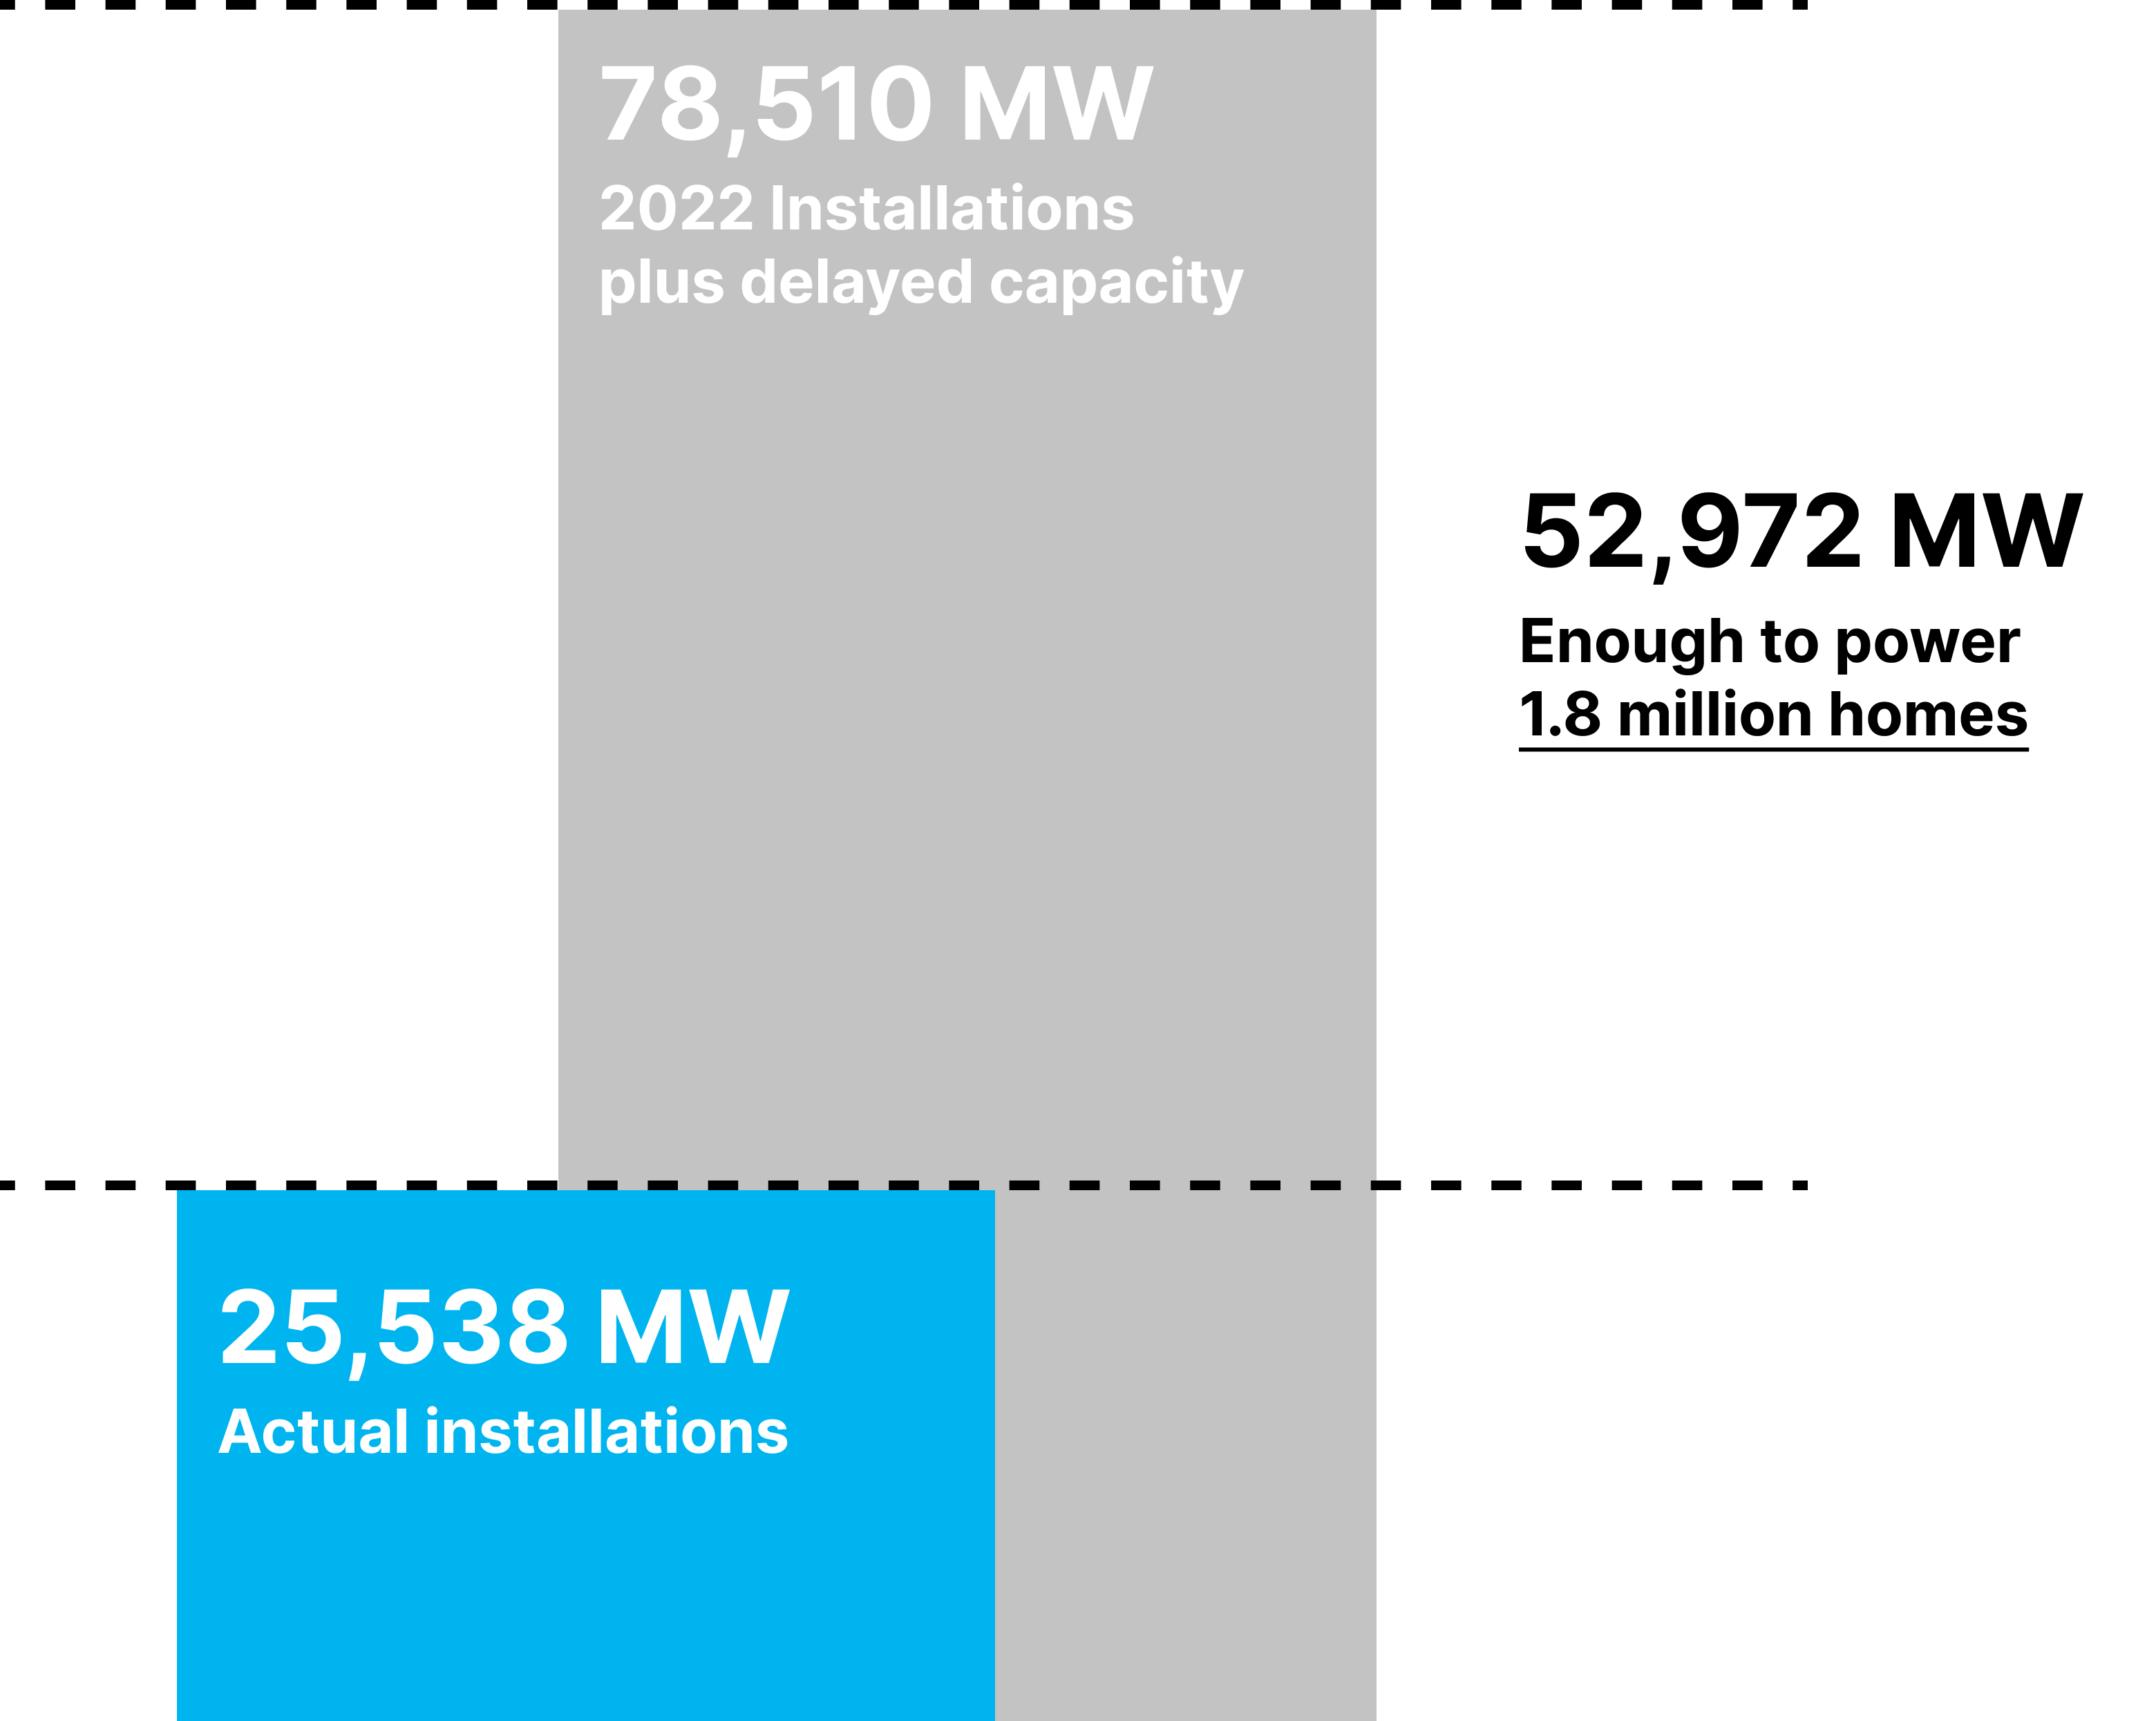
This slowdown was driven by multiple factors, including sourcing difficulties for solar panels, supply chain constraints, interconnection issues, and policy uncertainty tied to the previous phase-out schedule of the Production Tax Credit (PTC). These challenges caused delays in nearly 53 GW of projects in 2022. 

Cumulative Clean Power Capacity

More than 25.5 GW of clean power was installed in 2022, representing enough electricity to power 5 million American homes. In total, nearly 228GW of clean power is operating and powering American homes and businesses. 

Only four states installed more than 1 GW in 2022. 

Clean Power Share of U.S. Electricity Generation

Two decades ago, less than 0.5% of U.S. electricity came from clean power. It took another five years to pass the 1% mark, and growth continued at about 0.5% per year.  

Starting in 2016, this growth rate accelerated, nearing a 2% increase per year over the past three years.  

By 2022, 15% of U.S. electricity came from zero-emission wind and solar power.  

The remainder of electricity in 2022 was generated by natural gas (39%), coal (19%), nuclear (17%), hydropower (6%), and other renewable and fossil fuel sources. 

State-by-State Penetration

Clean power has become an indispensable source of electricity generation in states throughout the country. It accounts for 40% of electricity generation in 5 states, more than 20% in 18 states, and over 5% in 35 states.

Power Capacity Additions

The majority of electricity generation added to the grid in 2022 was from clean power technologies – wind, solar, and battery storage – along with gas. This has been the case every year since 2014.  

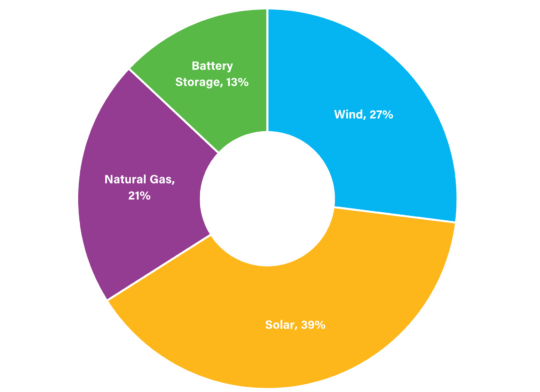
For just the second time, solar capacity additions outpaced land-based wind, capturing nearly 40% of the total market. Land-based wind followed in second with 26% of new additions. Utility-scale battery storage capture 12% of the market, leaving clean power resources with 79% of 2022 installations. 

Reaching A Net Zero Grid

If the industry built 25.5 GW of clean power annually for the next 13 years, the U.S. would only have 30% of the clean power resources required for an emissions-free power sector by 2035. 

Rush of New Manufacturing Activity

As of 2022’s end, over 550 clean power manufacturing facilities are operating nationwide, with numbers poised to rapidly grow since the Inflation Reduction Act’s passage.  

From August 16th, 2022, through Q1 2023, ACP has tracked 47 announcements of new, expanded, or re-opened utility-scale clean energy manufacturing facilities: 27 solar, 10 grid-scale battery storage, 8 in wind power, and 2 in offshore wind power.  

These burgeoning sectors are projected to support 18,000 manufacturing jobs. 

Clean Power Development Pipeline

After historic clean energy incentives were signed into law in August 2022, clean power has seen record levels of announced activity, with the development pipeline swelling to 137 GW by the end of 2022 14% above where it was at the same point last year 

In the 137 GW development pipeline, solar accounted for 58% of all clean power capacity. Land-based wind accounted for 15% of the pipeline, battery storage represented 13%, and offshore wind claimed the remaining 13%. 

National Highlights

Read the article
Clean energy is operating and powering American homes and businesses in every state in the nation, supplying emissions-free electricity and good quality jobs.

Operating U.S. Clean Power Projects

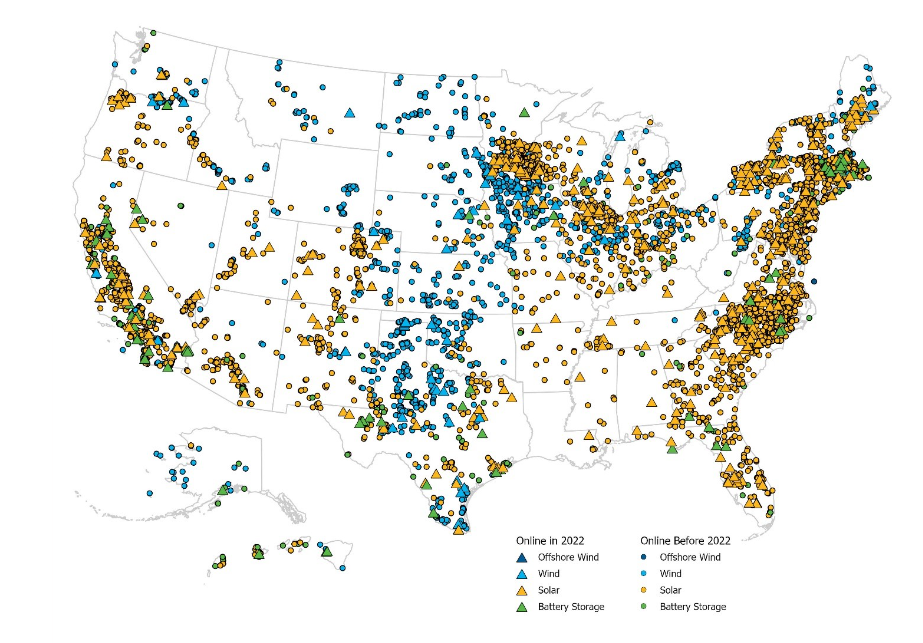
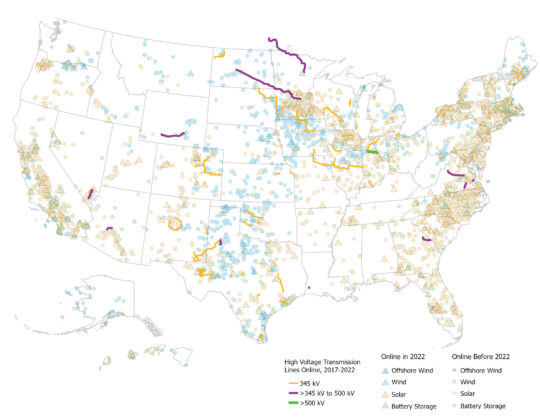
A Map of Energy Facilities Online as of 2022.

After installing 25.5 GW in 2022, there is now nearly 228 GW of clean power operating across the nation. Use the map above to explore a few of the projects brought online in 2022 by clicking on the purple circles. 

State Level Highlights

Read the article
Every state in the nation is seeing the benefits of clean power – and some are leading the charge. 

In 2022, there was a 13% increase in cumulative operating clean power capacity.

States with relatively low levels of clean power operating in 2021 showed the highest percentage increase in operating clean power – namely Kentucky, Delaware, Tennessee, and Louisiana – each increasing their operating capacity by more than 50%. The leaders in new capacity additions, however, already have significant clean power presence in their states.

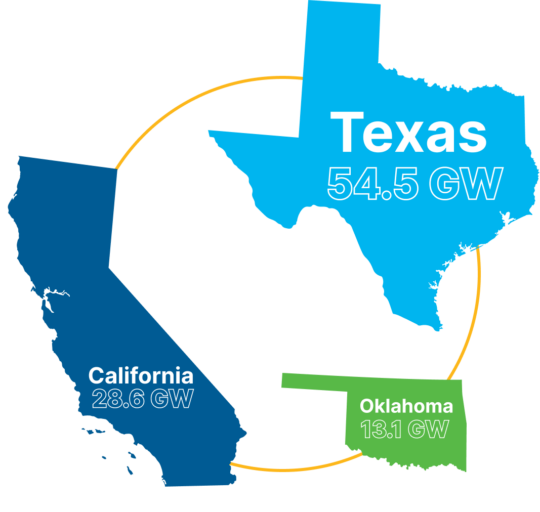
Top States for Clean Power Capacity in 2022

Graphic of top 3 states with clean power capacity in 2022.

Texas, California, and Oklahoma led the nation for clean power installations in 2022, together accounting for 60% of total installs. Only one other state, Florida, installed more than 1 GW in 2022.

Despite low overall installations, 18 states, including Texas and California, set new annual installation records in 2022.  

Cumulative State Rankings by Tech

Top States with Operating Wind Capacity

Top States with Operating Solar Capacity

Top States with Operating Battery Storage Capacity

Texas leads the nation in operating wind capacity, while California leads in both solar and battery storage. Texas ranks second for total operating solar and battery storage capacity, while the wind-rich Plains states follow Texas in operating wind capacity.  

Annual Land Lease & State and Local Tax Payments

2022 Land Lease Payments

2022 State & Local Tax Payments

Clean power projects contribute nearly $3 billion annually to local communities through annual tax payments and landowner lease payments.  

Land lease payments from clean power projects provide communities with additional income, stimulate local economies, diversify revenue sources, and support public services, all of which contribute to the overall well-being and sustainability of the community. 

In 2022, the clean power industry paid an estimated $1.4 billion in state and local taxes and nearly $1.5 billion in land-lease payments to landowners across the U.S.  

81% of U.S. clean power capacity is installed in low-income counties, creating economic opportunities for communities that need it most. Online clean power projects in low-income counties delivered nearly an estimated $1.2 billion in lease payments to landowners in 2022, along with $1.1 billion in state and local tax payments.  

Clean Power Manufacturing

Manufacturing Facilities

There are more than 550 active clean power-related manufacturing facilities in the U.S.  

As the most mature clean power sector in the U.S., wind-related facilities make up a bulk of the current manufacturing footprint with 450 U.S. facilities operating. Aside from providing major components such as blades, towers, and nacelles, hundreds of small manufacturers provide other components such as coatings, lubricants, power transmission components, and other raw materials to the wind sector. 

There are over 90 utility-scale solar-related manufacturing facilities in the U.S., including 10 module manufacturers, 20 racking manufacturers, and dozens more manufacturers of other components.  

In addition, there are 10 major utility-scale battery manufacturing facilities across the country. 

The Inflation Reduction Act has unleashed a wave of investment in domestic clean power manufacturing. As of March 31, 2023, companies have announced 47 new or expanded manufacturing plants serving wind, solar, and energy storage technologies. 

Industry Headwinds

Read the article
Although clean power installations had been on a growth streak, 2022 saw a 15% decrease compared to the peak year of 2021.

This slowdown was due primarily to delays in nearly 53 GW of projects starting in late 2021, triggered by challenges in sourcing solar panels, supply chain constraints, interconnection issues, and policy uncertainty related to the previous phasedown schedule of the PTC.  

These factors proved to be significant barriers for many clean power projects. 

Delays Continue to Mount

Project delays

Graph displaying MW of Energy Project Installations versus Delayed Capacity.

Since the end of 2021, nearly 53 GW of clean power capacity has been delayed and failed to come online.

Solar accounts for 68% of delayed clean power capacity, due primarily to difficulty sourcing panels as a result of trade restrictions. Wind represents 18% of total delays. Causes of wind delays range from ongoing supply chain constraints to grid interconnection delays. Battery storage projects are the least affected, making up just 14% of delays. Most delayed storage projects are co-located with delayed solar projects. 

Transmission

Transmission is critical to maintaining a reliable electricity grid and to integrating clean energy resources efficiently and effectively.  

In 2022, utilities and independent transmission developers added just 675 miles of new transmission. This is a 50% reduction from 2021 installation volumes and marks the fewest miles built in the decade. 

Decline in Annual Installations

For the first time since 2017, annual clean power installations dipped in 2022 due to numerous industry challenges. Trade restrictions complicated panel sourcing for developers, while supply chain constraints and lengthy interconnection queues prolonged project timelines. Policy uncertainty before the Inflation Reduction Act (IRA) was passed and a lack of clarity in its implementation also stifled the sector. 

Despite these hurdles, the 25.5 GW installed in 2022 still marks the third most productive year for clean power commissioning. The passage of the IRA has further ignited massive investment in clean power, a shift that promises to significantly boost installations over the coming decade, as evident in the rapidly expanding development pipeline. 

Clean Power Purchases

Read the article
By announcing an increasing number of new clean power purchase agreements (PPAs), corporate buyers have significantly raised their commitments to clean power. In 2022, corporations set a new record for PPA announcements and, for the first time, accounted for more than half of all new PPA announcements.

Power Purchase Agreements

Top Companies Announcing PPAs in 2022

Of the top 20 companies announcing new PPAs in 2022, 11 are utilities and 9 are non-utility companies, primarily commercial & industrial (C&I) buyers.  

For C&I purchasers, Amazon leads the pack by a considerable margin. The technology giant announced nearly 6.5 GW of new PPAs in 2022. Meta and Verizon close out the podium in 2022 with 2 GW and 1.2 GW of PPAs, respectively, announced in 2022.  

Exelon Corporation is the only utility to announce more than 1 GW of new PPAs in 2022. 

In total, almost 100 entities announced new PPAs in 2022, driving the industry to its second highest year of PPA announcements to date. 

Corporate Purchasers of Clean Power

Top 10 Corporations Purchasing Clean Power

Corporations are increasingly turning to clean energy to power their business activities—delivering products, services, and experiences that are powered by clean energy.  

Amazon has contracted the most clean power to date after rapidly increasing procurement activity over the past two years. Meta and Google, early adopters of clean energy, rank second and third in terms of total operating capacity.  

Much of the C&I contracted capacity is for clean power projects still in development. Meta has the most operating clean power contracted and operating its business. Amazon ranks second for operating contracted capacity. 

Learn more about corporate buyers of clean power in ACP’s Clean Energy Powers American Business report. 

Top Purchasers of Operating Clean Power

As calls to decarbonize grow louder, demand for clean energy has surged amongst both utilities and non-utility entities. Buyers secure clean energy either through offtake contracts or by directly owning the assets. While Investor-Owned Utilities lead the pack in purchasing operating clean power, several corporate buyers are moving up in the ranks. 

Climate and Health

Read the article
Clean energy sources like wind and solar are critical parts of reducing harmful pollution and combating climate change.

Deploying zero-emission energy sources like land-based wind, offshore wind, and solar will help drive the clean energy economy forward while benefiting people and the planet. 

Benefits of Clean Power

Carbon Emissions

Zero

Zero metric tons of carbon dioxide is emitted when wind and solar generate electricity

426M

426 million metric tons of carbon dioxide emissions avoided per year with current U.S. wind and solar power, the equivalent of 93 million cars worth of carbon emissions

$20-51B

$20-51 billion dollars is the economic value of health benefits from emission reductions from current clean power generation

Clean Power Technologies

Read the article
Wind, solar, and energy storage have become the lowest-cost option for new capacity additions, leading new installations and helping the nation rapidly deploy affordable, reliable clean energy.

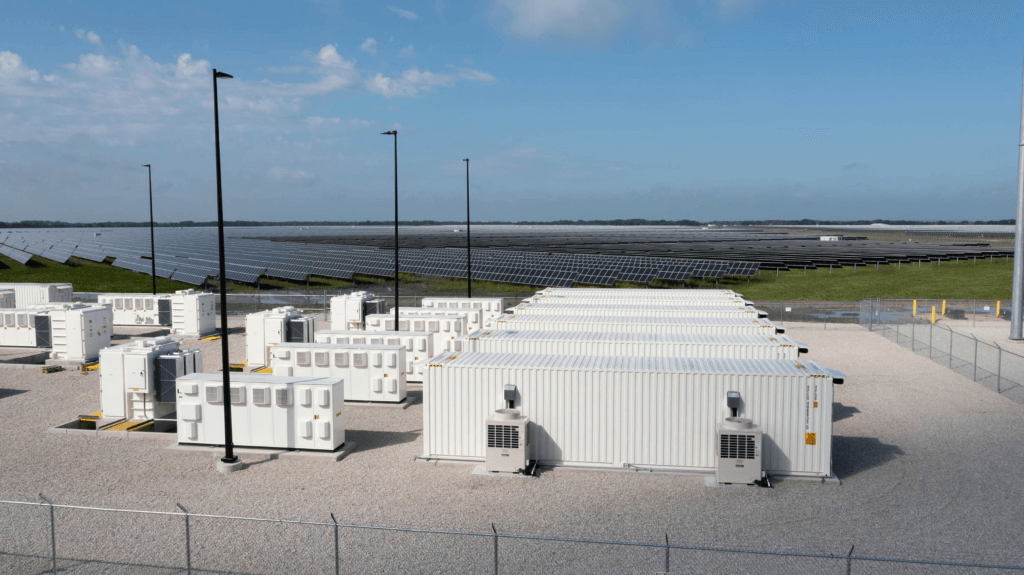
Battery Storage and Hybrid Projects

Battery Storage Capacity

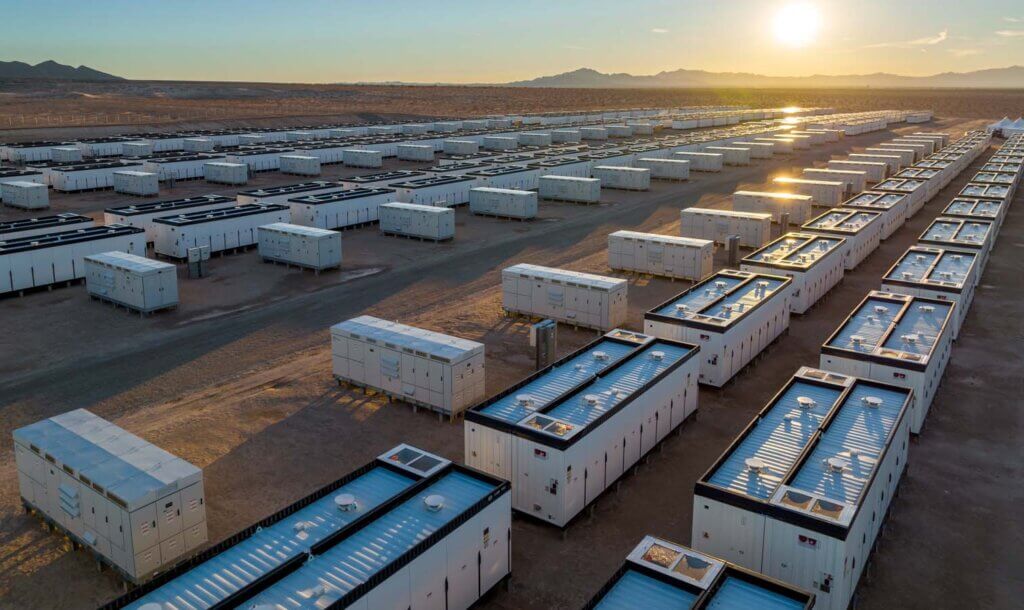
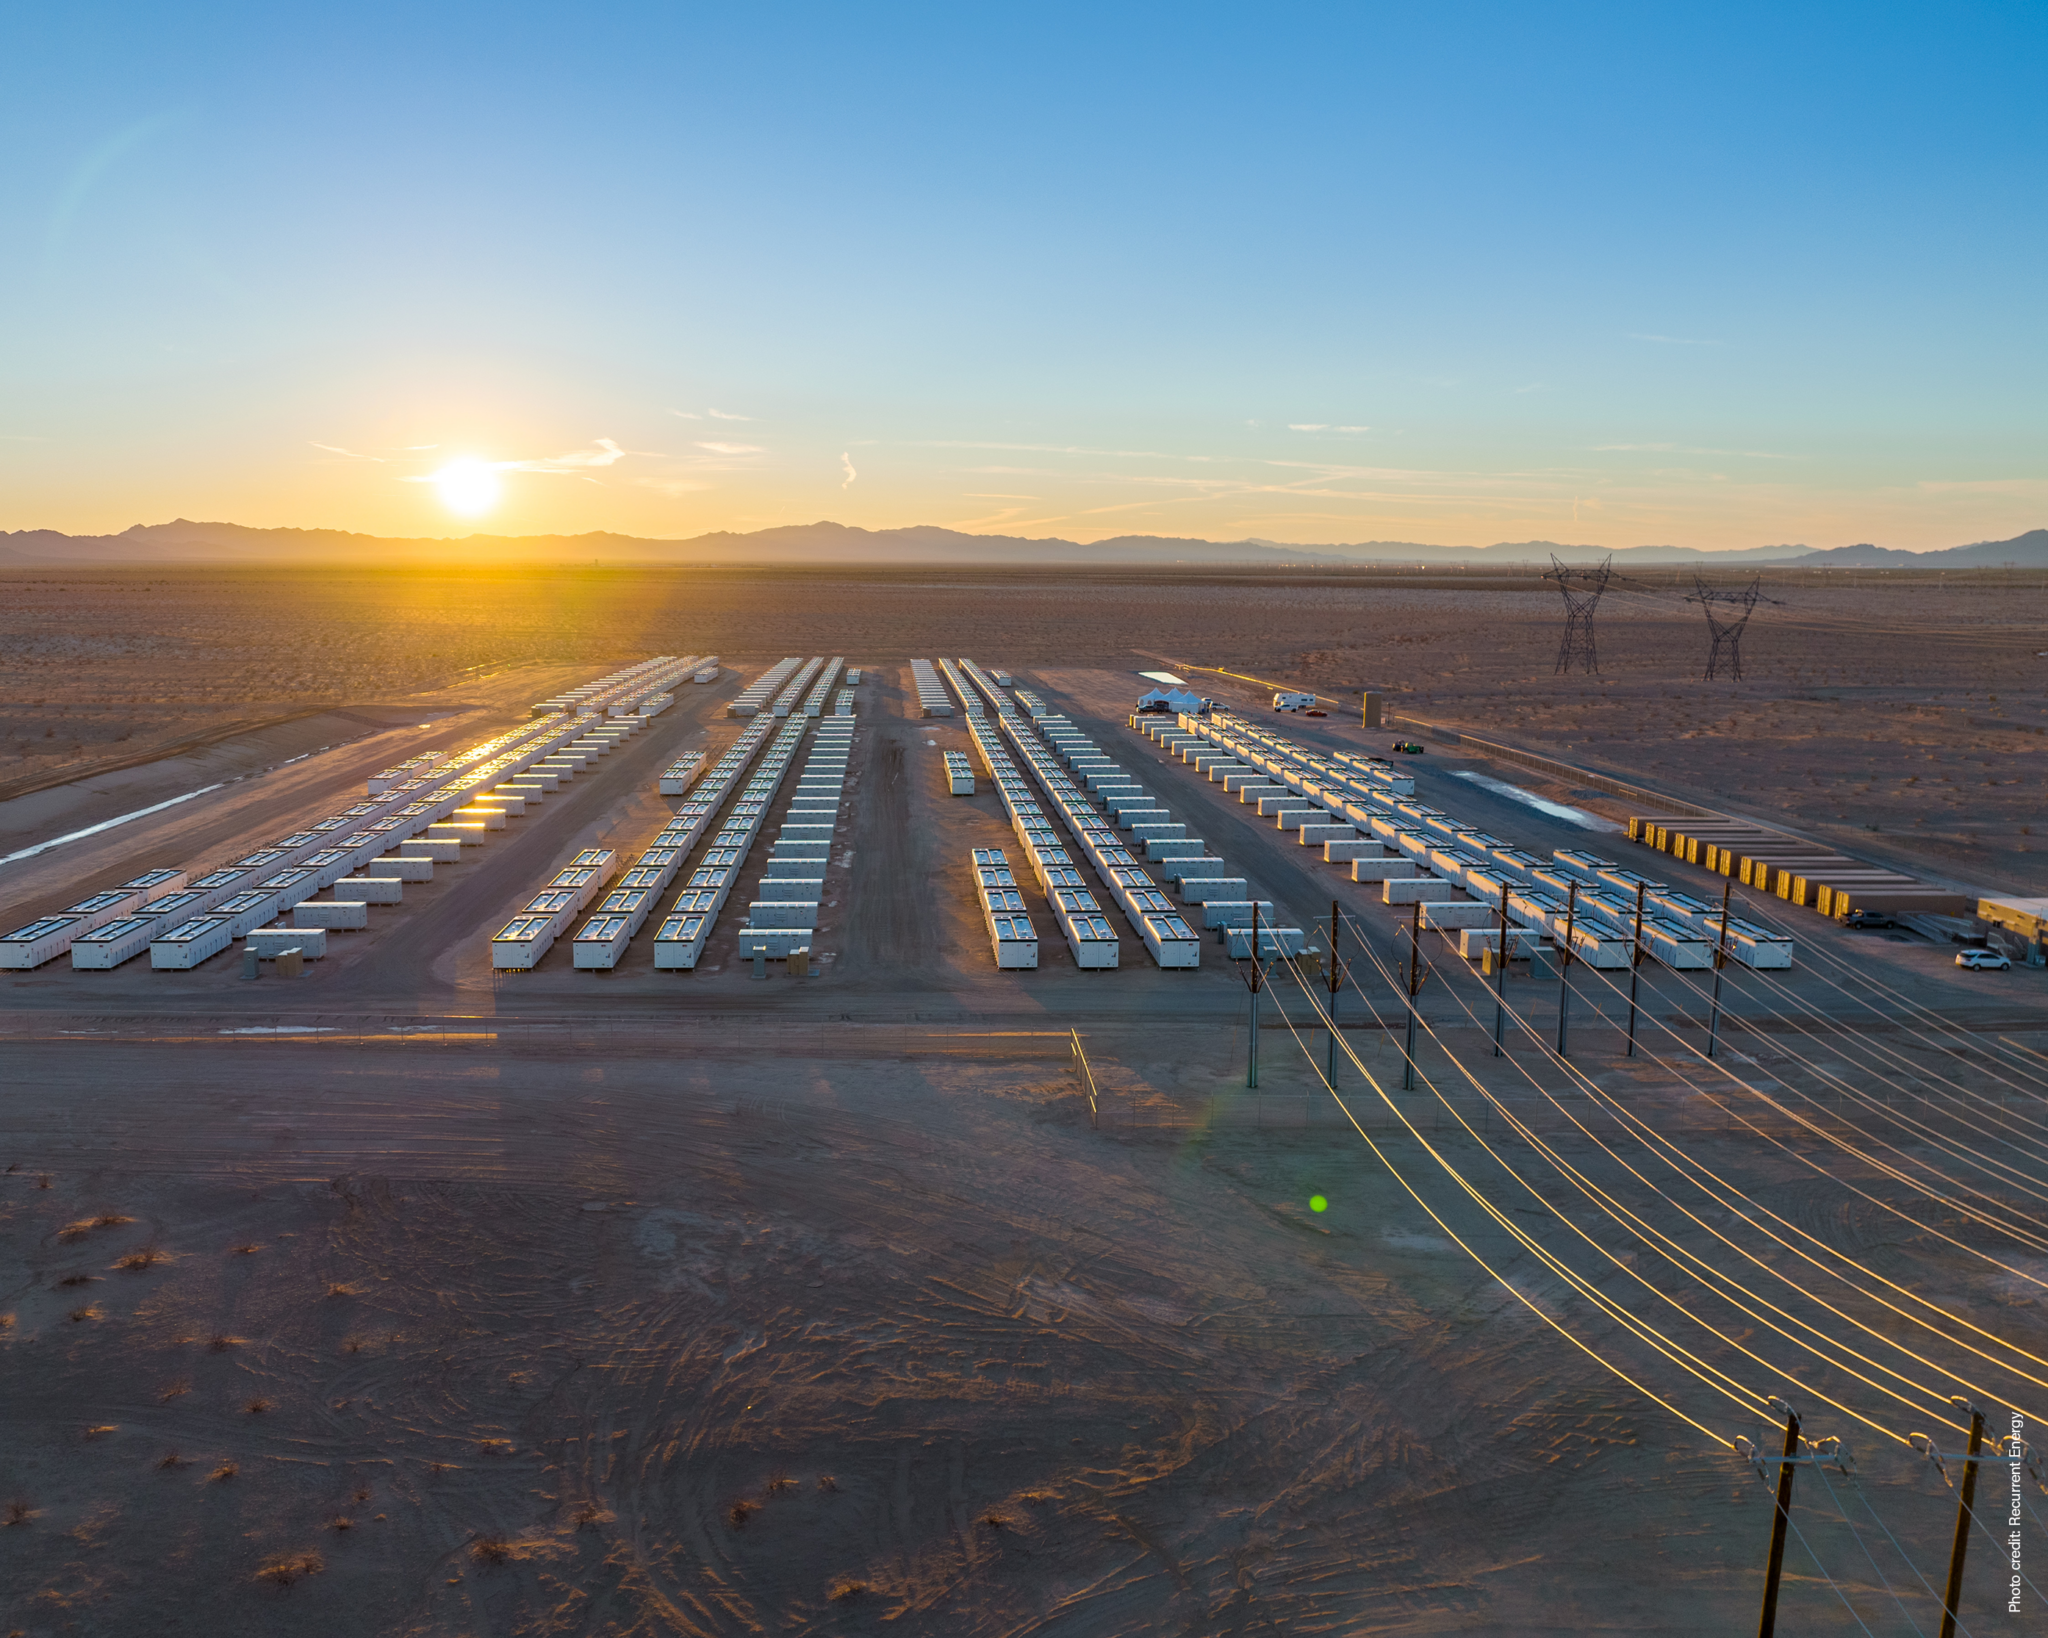
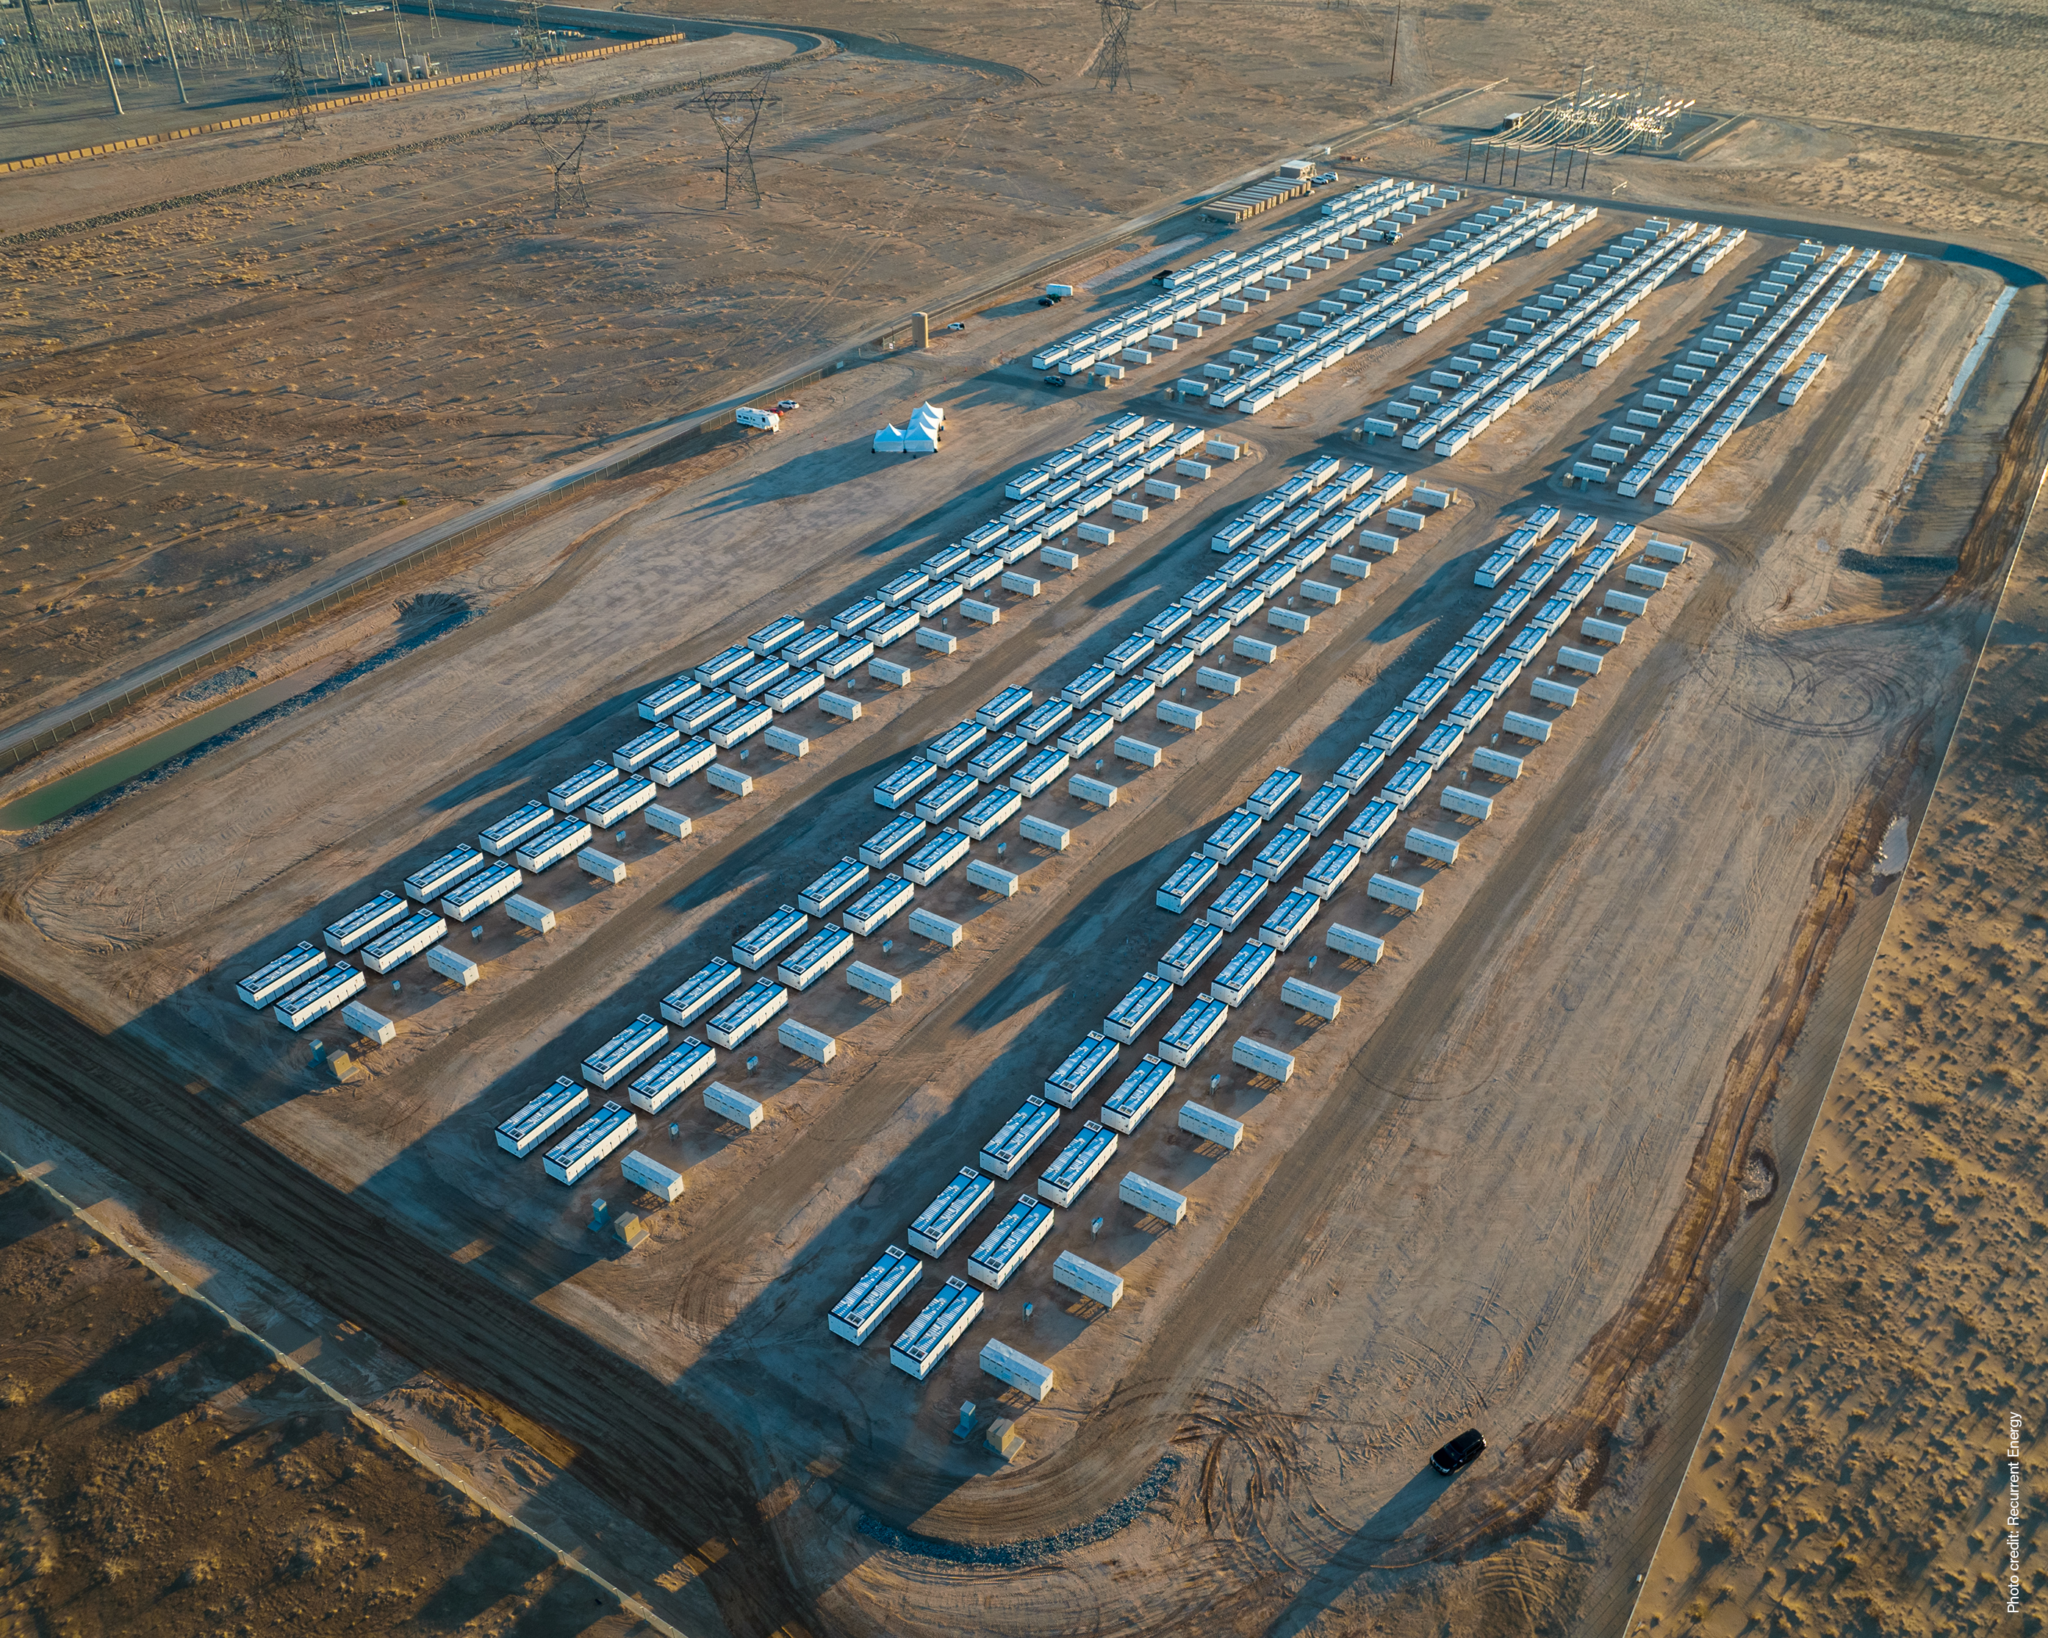
Battery storage has been on a rapid upward trajectory over the past few years. 2022 represents a record year for battery storage, with 4,034 MW/12,149 MWh commissioned. Cumulative operating capacity (MW) increased by 80% in 2022 and cumulative energy storage capacity (MWh) increased by 93% in 2022. 

Operational Hybrid Capacity

Hybrid projects – wind or solar generation paired with storage – have become increasingly popular. In 2022, nearly 6 GW of new hybrid project capacity came online, 88% of which is comprised of solar + storage projects. In total, nearly 18.45 GW of hybrid capacity is operational in the U.S.  

Land-Based Wind Power

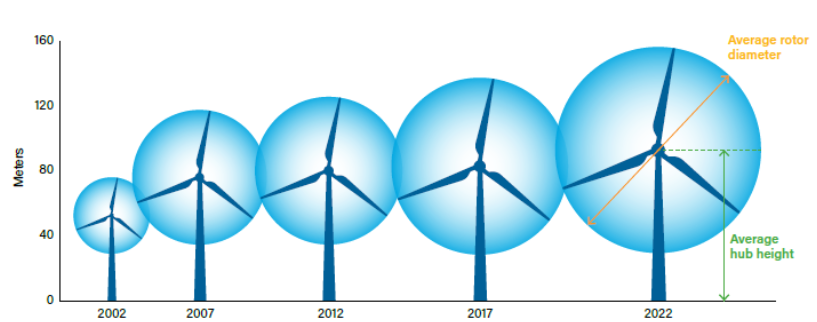
The Evolution of the Average Wind Turbine

A Graphic Displaying the Evolution of Wind Turbine Sizes Over Time.

Over the past decade, the average hub height of land-based wind turbines has increased by 16% since 2012, reaching 94 meters in 2022, while the average rotor diameter reached 127 meters, a 40% increase from 2012. Consequently, the average turbine nameplate capacity has increased 60% since 2012 to 3.1 MW.  

Operating Land-Based Wind Projects

2022 represented another down year for the land-based wind industry with the lowest annual installs since 2018. 

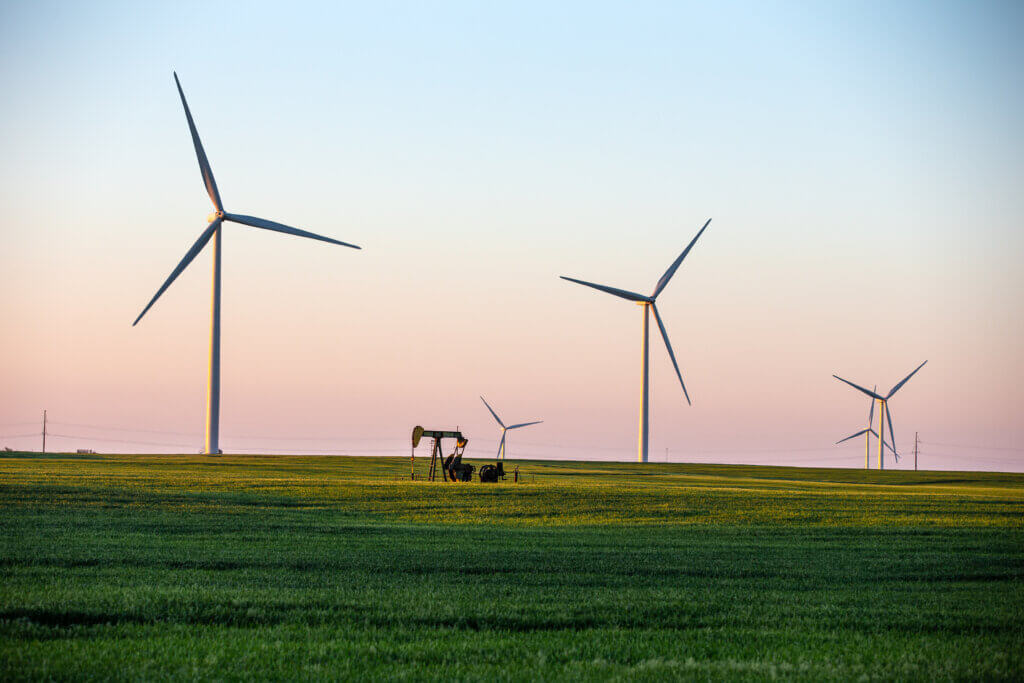
Developers installed 8.5 GW in 2022, bringing total operating capacity to 144 GW. Factors such as changes in incentives, fluctuations in costs, and delays in permitting and regulatory approvals may have influenced the reduced number of commissioned wind projects. 

Texas has the most operating wind capacity at 40.2 GW, followed by Iowa (12.8 GW) and Oklahoma (12.2 GW). Texas and Oklahoma also lead new installs in 2022.  

Offshore Wind Power

Offshore Wind Targets by State

Ten states have set offshore wind procurement targets totaling over 81,000 MW. Louisiana, California, New Jersey, and Maryland all set or increased offshore wind goals between the start of 2022 and April 2023.  

Utility-Scale Solar

Operating Utility Solar Capacity by State

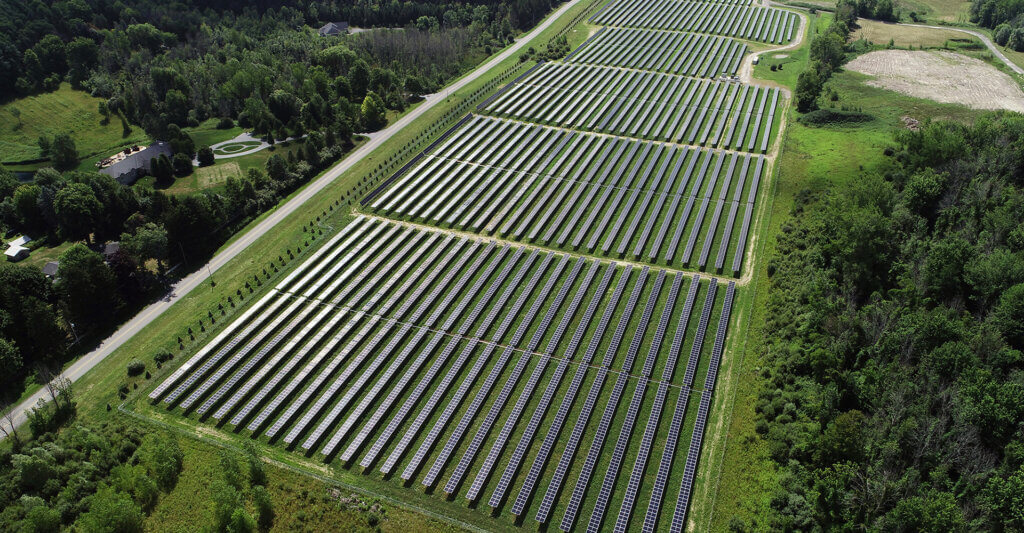
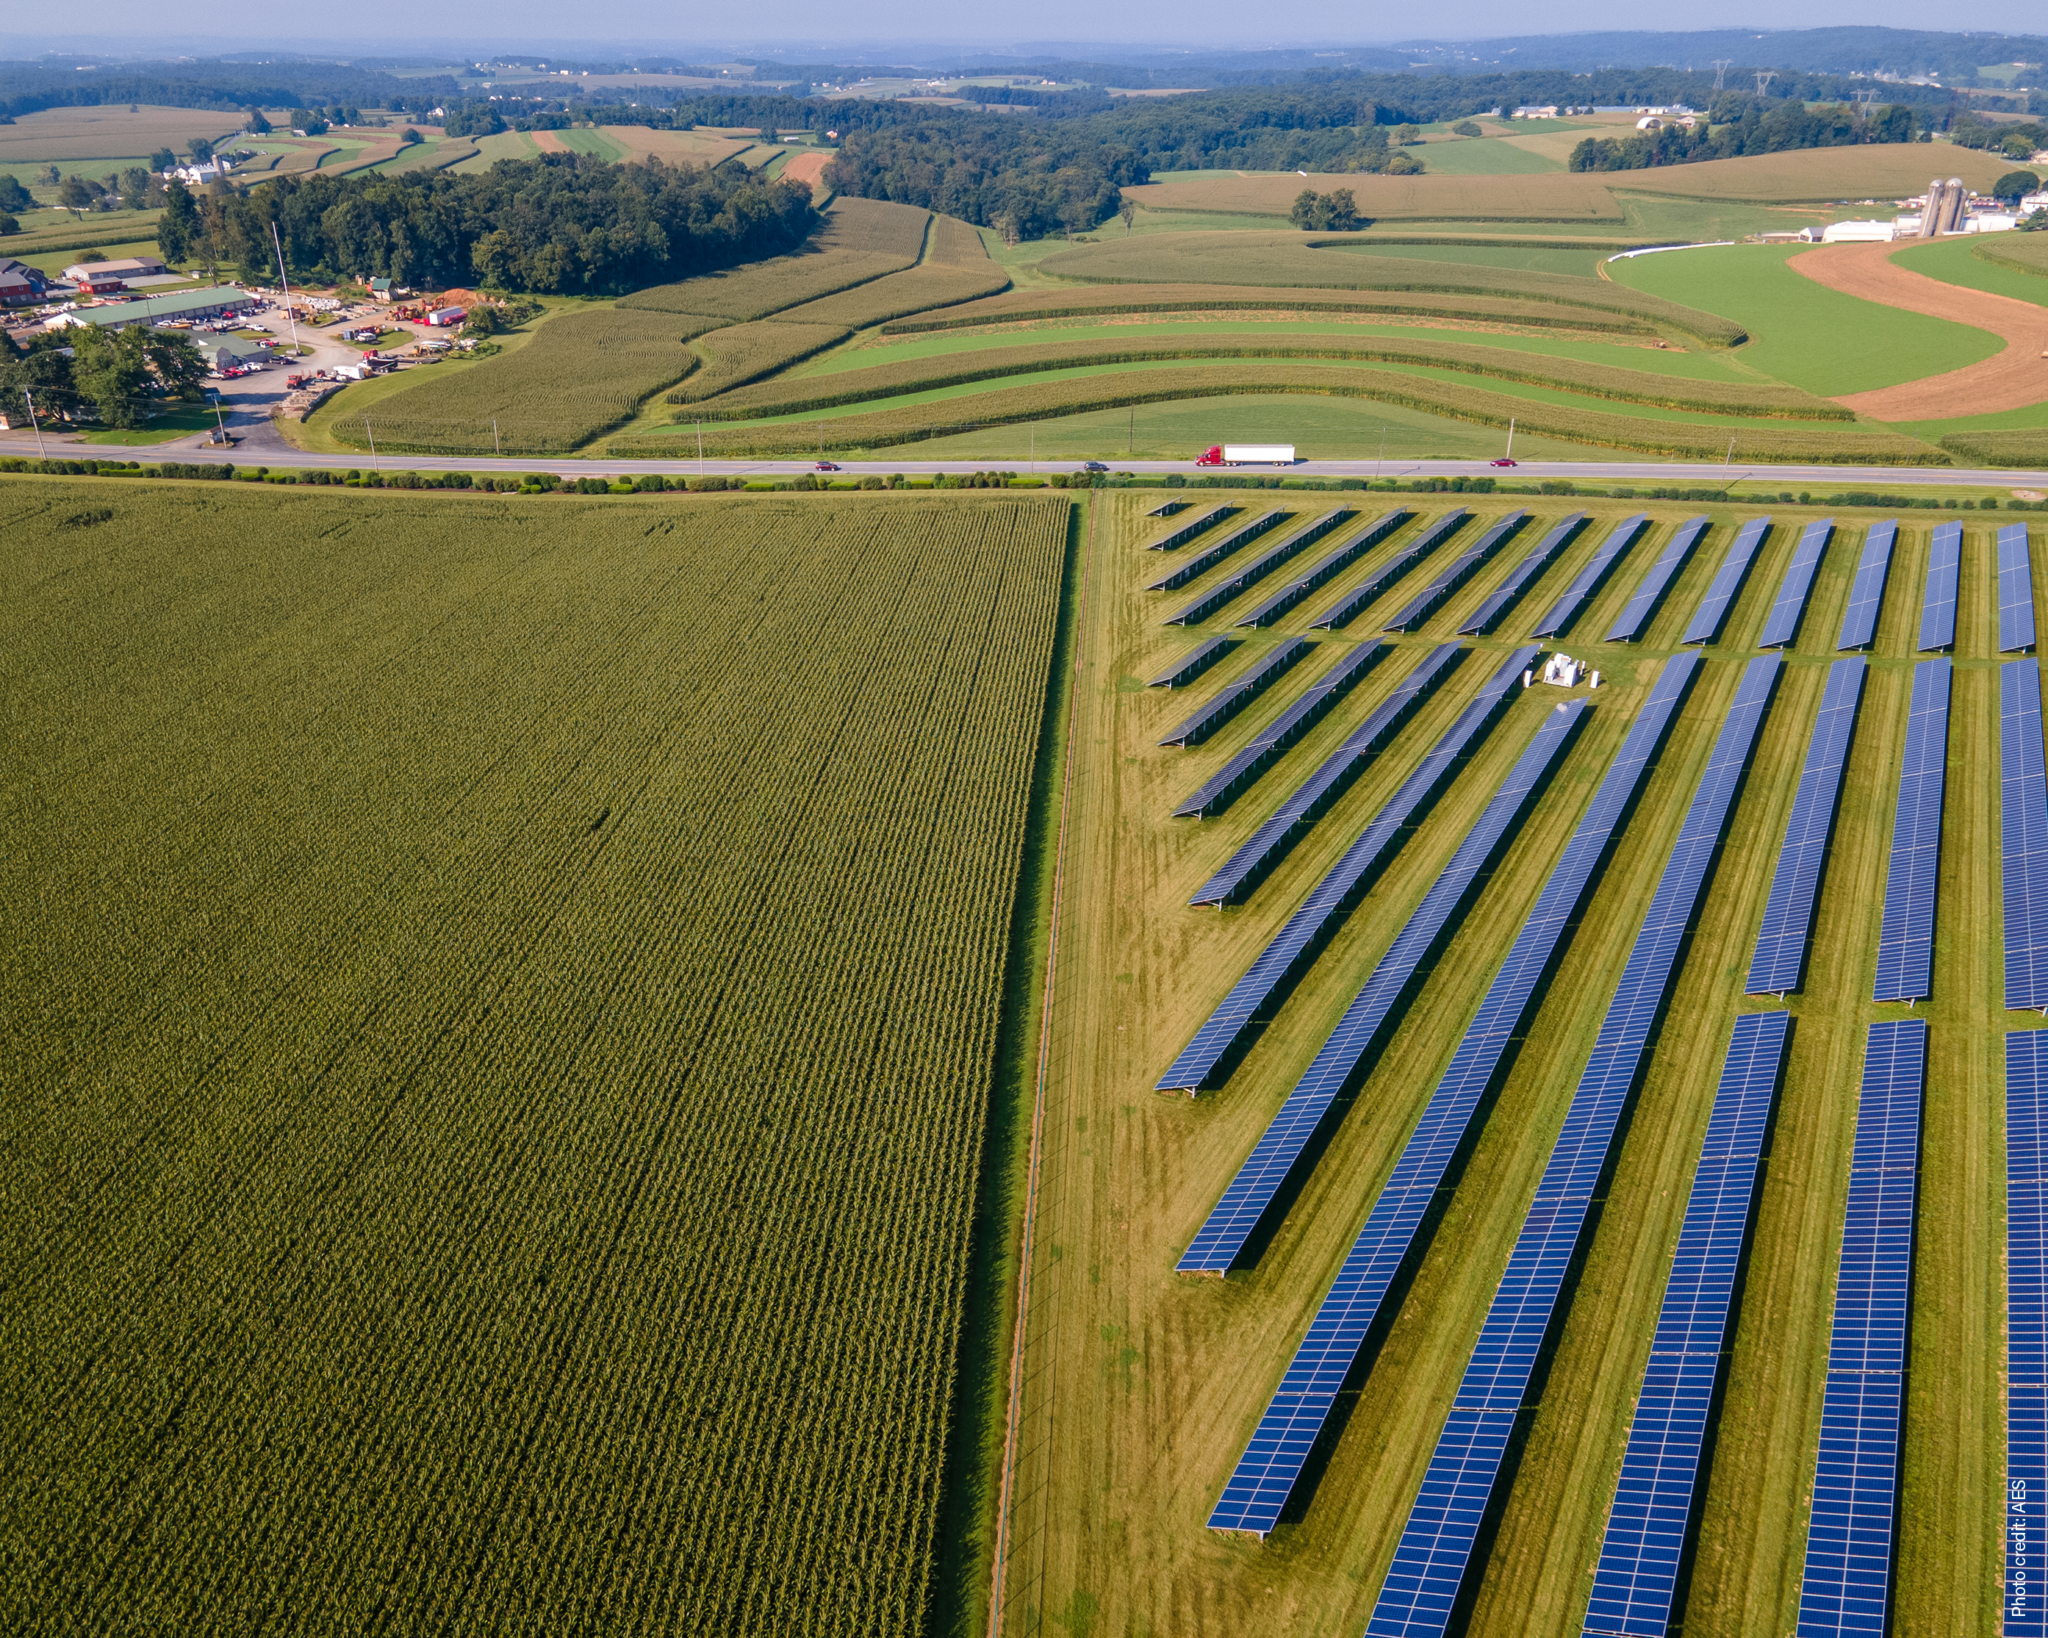
The 13 GW of utility-scale solar installed in 2022 falls 3% short of the record year in 2021. In total, nearly 75.6 GW of utility-scale solar is operating.  

With plentiful solar resources, supportive solar policies, and a large population, California continued to lead the U.S. in terms of solar capacity. However, Texas installed more new solar capacity in 2022, while California ranked second.  

Looking for more?

Become an ACP member to gain access to the full 180-page annual market report and more business insights.

An American Clean Power membership unlocks access to exclusive resources such as this report. The free public version of the report, which provides a summary of key takeaways and graphics from the full report, is available for download.

However, the full Clean Power Annual Market Report | 2022, containing in-depth analysis of trends across the U.S. clean energy sectors, is available for members only. Not a member? Join now.