Clean Energy Powers America

2021

Explore the Annual Report

Welcome to the Clean Power Annual Market Report 2021

In 2021, the U.S. clean power industry hit significant milestones, but current growth must accelerate to reach net zero grid by 2035.

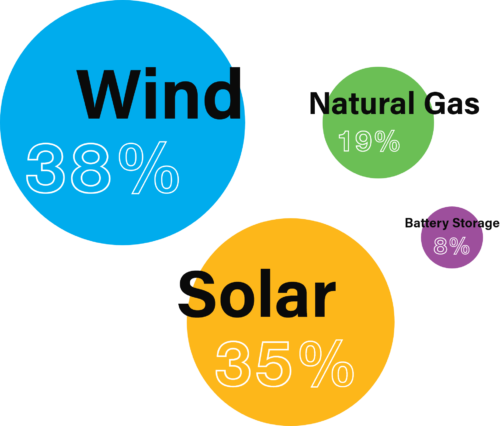
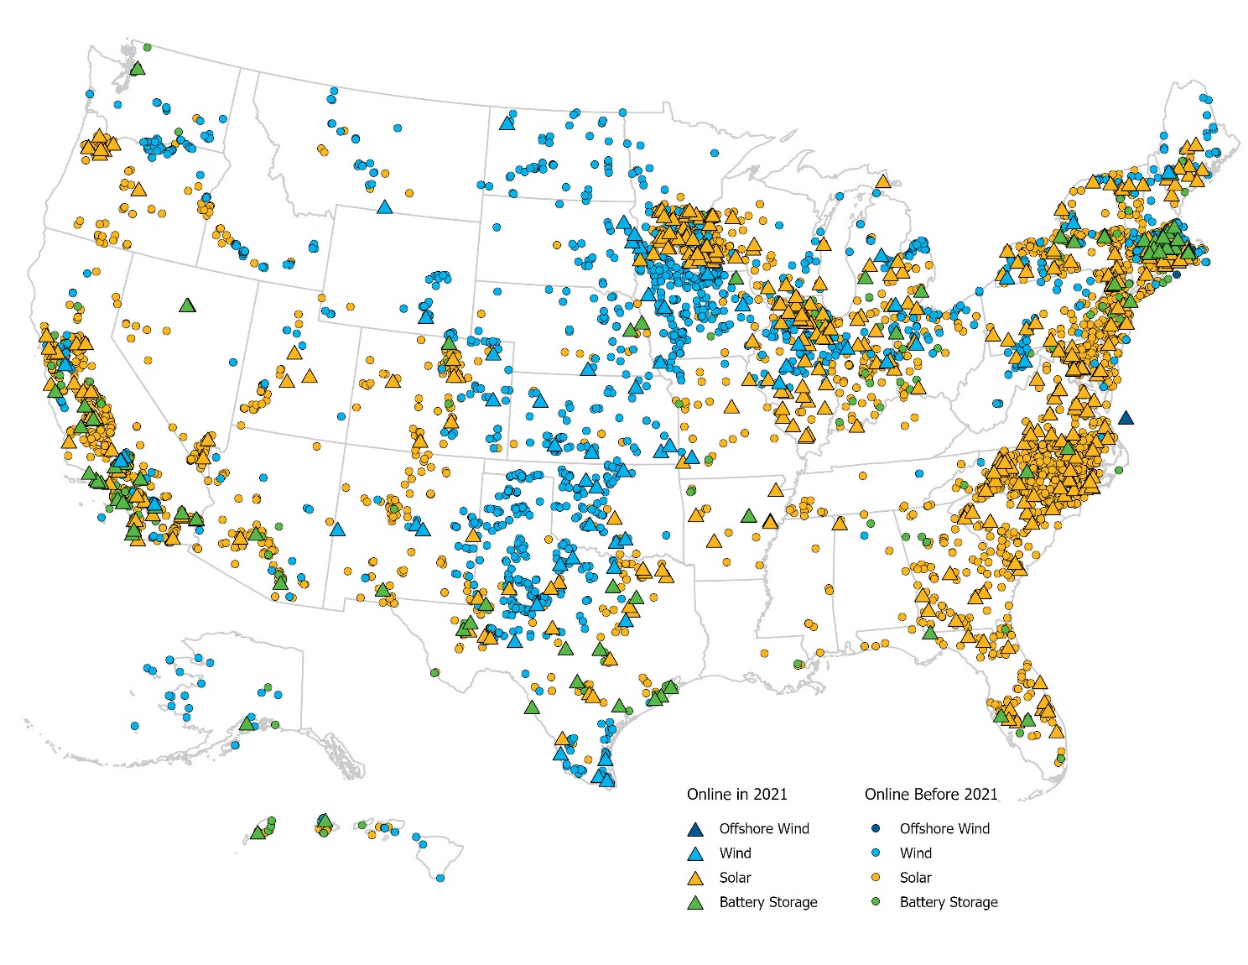
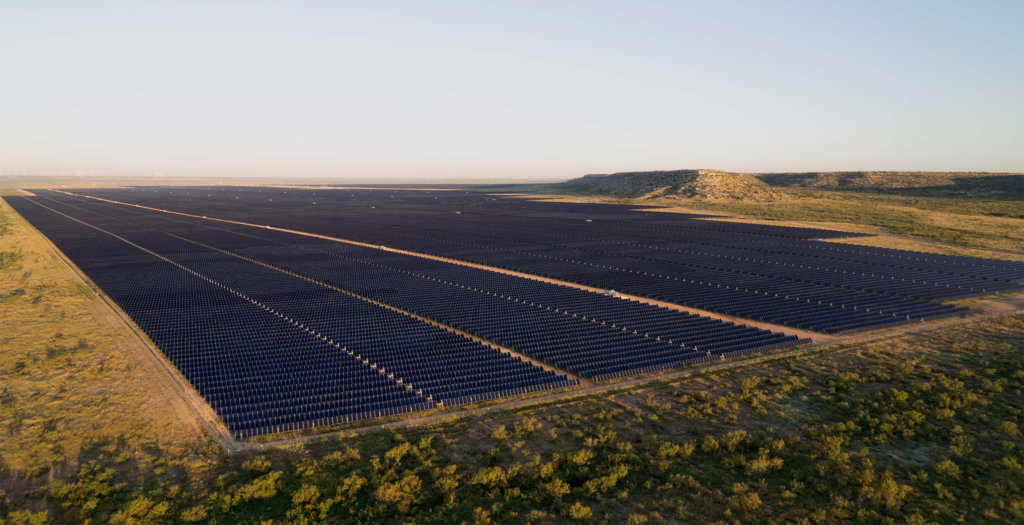
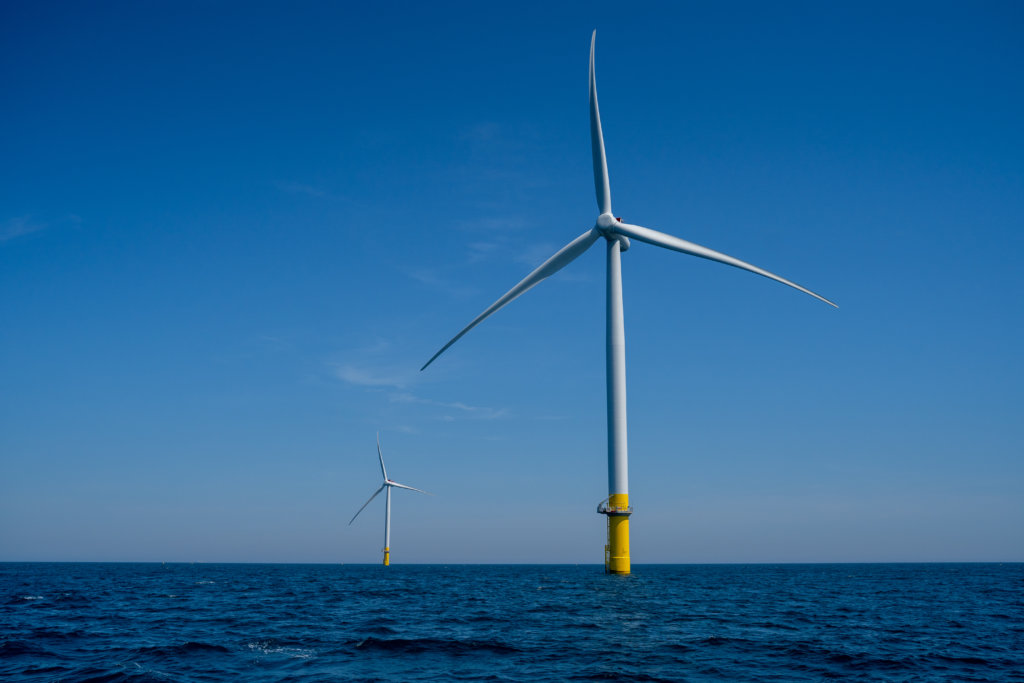
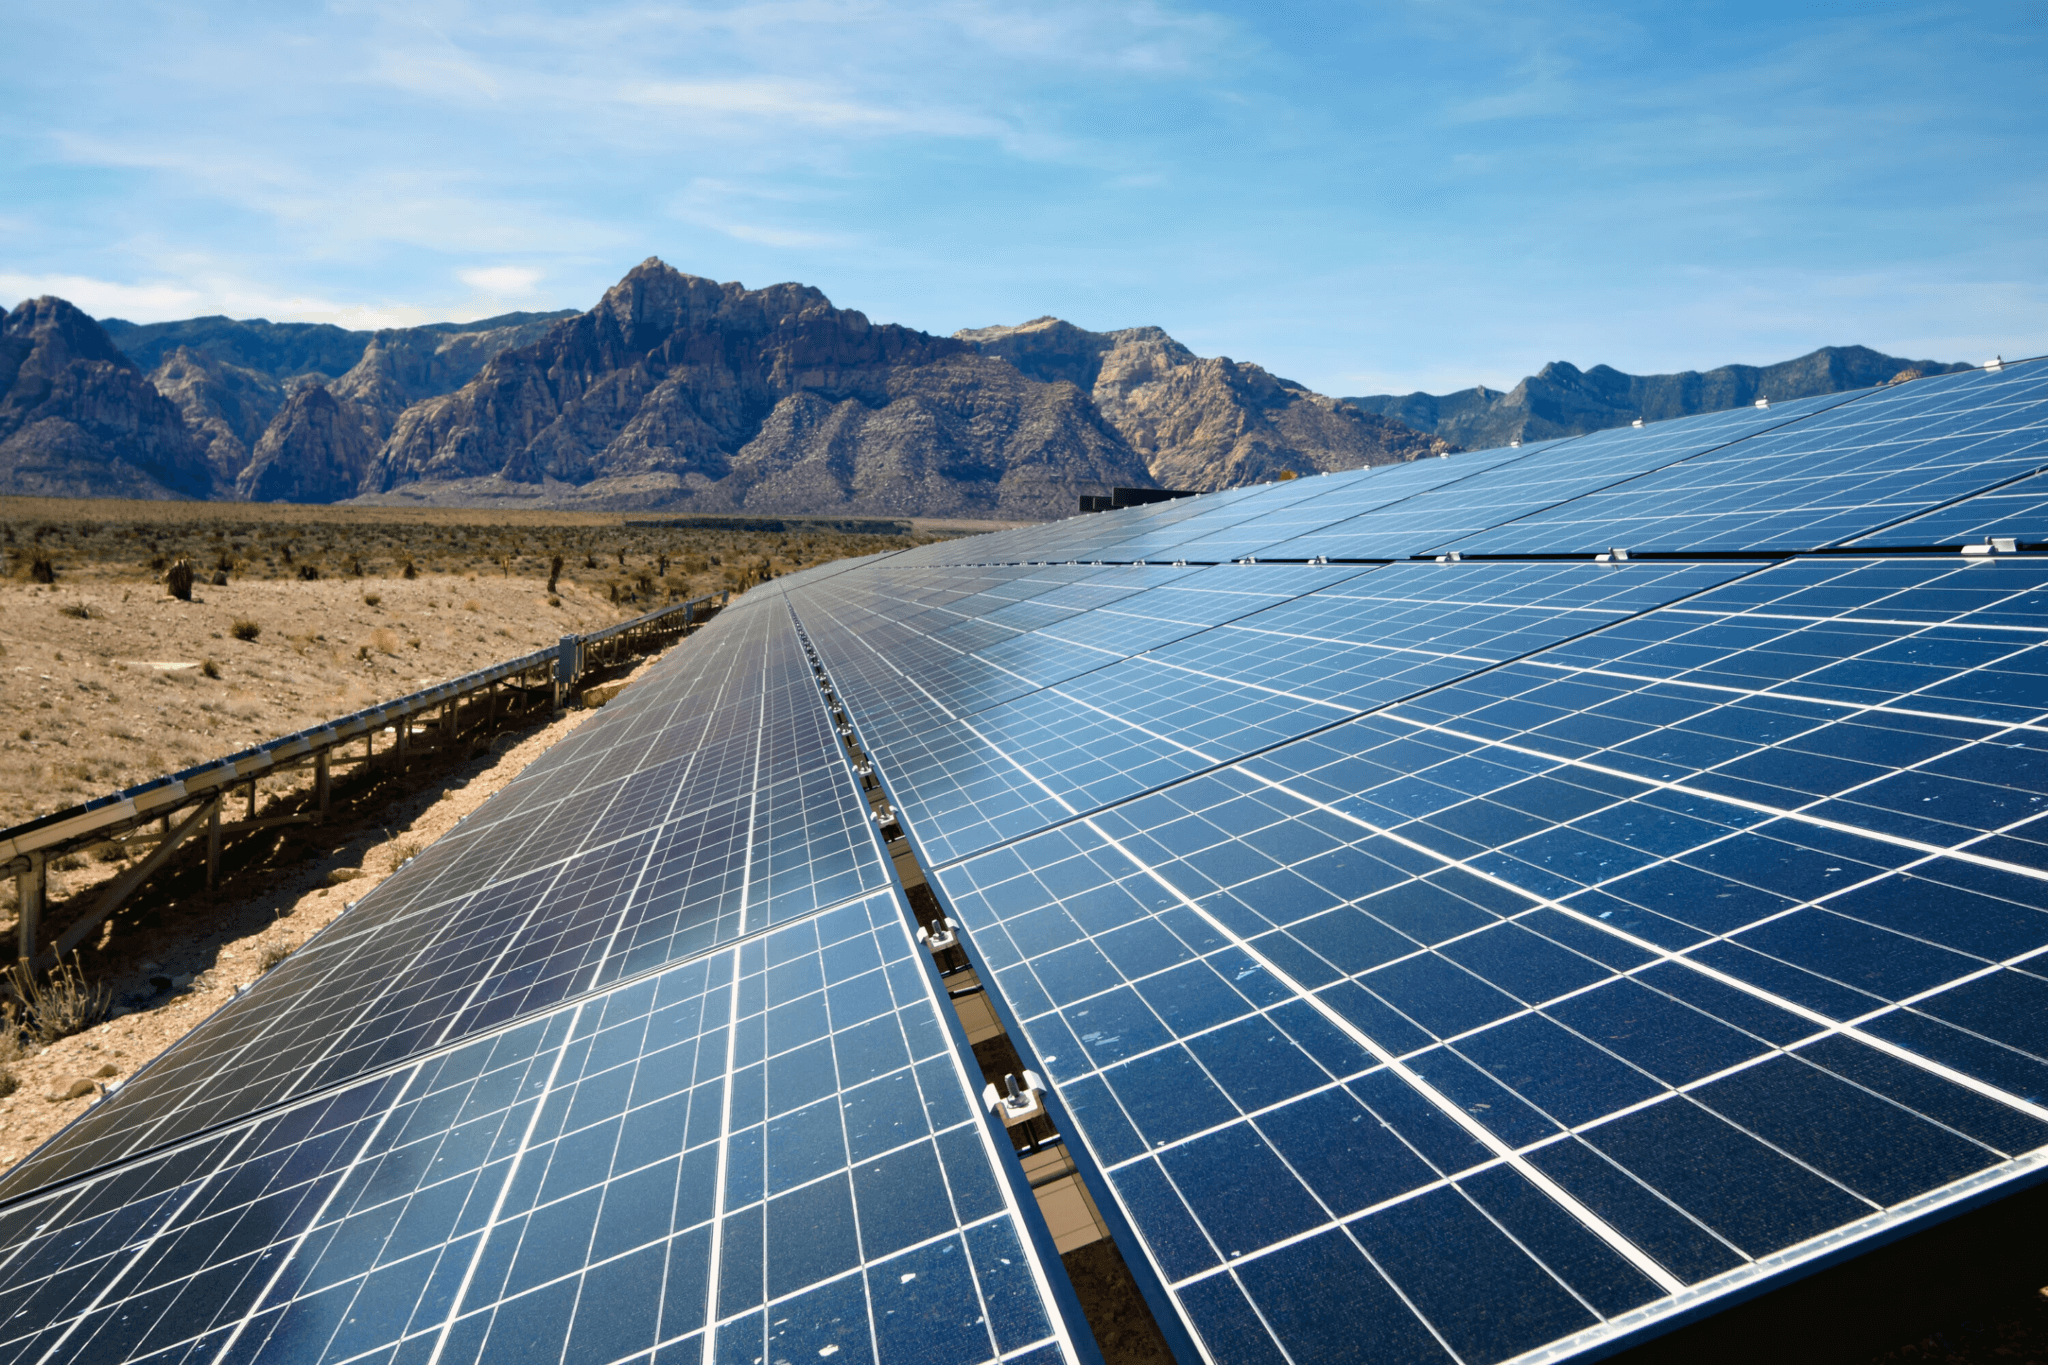
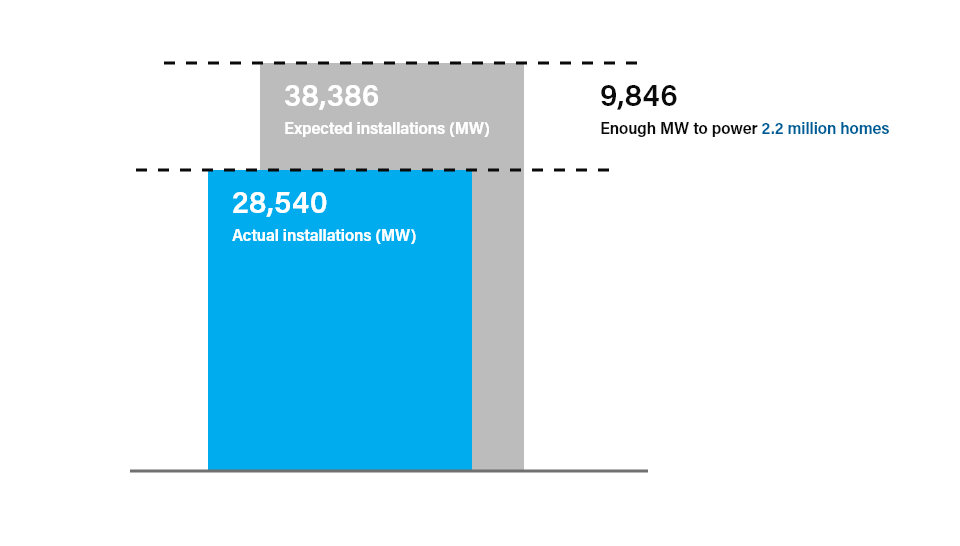
2021 marked a record year for clean power. Our industry reached a major milestone by surpassing 200 GW of renewable energy capacity. But despite this laudable progress, 2021’s pace of clean energy deployment must accelerate at a more rapid rate to meet America’s climate and emissions goals. While 2021 installations of solar and storage soared and costs remained low, bottlenecks in transmission and policy uncertainty threaten to stall future development. Understand the progress and challenges of American clean energy in 2021 by interacting below with data collected for ACP’s new Clean Power Annual Market Report 2021.

Clean Power at a Glance

Read the article
In 2021, wind, utility solar, and battery storage power capacity in the U.S. topped 200 gigawatts (GW) after 28.5 GW of clean energy projects came online in 2021.

28.5 GW is enough to power more than 6.6 million homes or 500 million LED lightbulbs.

Cumulative Clean Power Capacity

2021 and cumulative operational clean power

In 2021, over 28.5 gigawatts (GW) of clean power was added to the U.S. grid, enough to power more than 6.6 million homes and 500 million lightbulbs. Cumulative online clean power capacity is now over 201 GW, with every single state in the U.S. powering its communities with clean power. There are 35 states in the ‘gigawatt club,’ and 10 states now have 5 GW or more installed.

Online capacity

67%

Land-based wind

30%

Solar power

2%

Battery storage

Clean Power Installation Milestones

The U.S. has come a long way since reaching the milestone of 2 GW of clean power installed two decades ago. The rate of installs has increased rapidly over time, allowing the country to reach new clean power milestones more regularly. Over the past 5 years, the nation has added 100 GW, doubling the existing capacity from 2016.

More is Needed to Reach a Net Zero Emissions Grid

Current pace only provides 35% of the progress needed for a zero-emissions grid

Despite being the second largest year on record, the pace of installations in 2021 fell short of what is required to achieve a net zero emissions goal.

If the industry only built 28 GW annually for the next 14 years, the U.S. would only have 35% of the clean power resources required for an emission-free power sector.

Percentage of U.S. Electricity Generation – Wind and Solar

Clean generation share

Since 2001, clean power has gone from producing less than half a percent of total U.S. electricity generation to producing 13% of total electricity in 2021. The growth rate has increased significantly over time. During the first five years of the decade, clean power generation share increased by only 0.5% a year. Over the past five years, the share has increased by 1.2% annually on average.

Percentage of State Electricity Generation – Wind and Solar

State-by-state penetration

Clean energy is powering states across the country. Five states have a clean energy generation share of electricity above 30%, and 25 states in the U.S generate at least 10% of their electricity from wind and solar. Iowa leads the nation at 56% clean energy generation, followed by South Dakota at 52% – up from 33% just one year ago.

Clean Power Capacity Additions

Capacity rankings

Graphic representing the percentages of capacity rankings.

For the third year in a row, onshore wind led capacity additions, capturing 38% of the market. Utility solar was a close second, representing 35% of new additions. Battery storage captured 8% of the market, leaving clean power resources with 81% of 2021 installations.

National Highlights

Read the article
Clean energy powers more of America each day. In 2021, the industry built 594 clean power projects across 44 states, totaling 28.5 GW of operating capacity.

U.S. Clean Power Projects

Clean power projects generate renewable energy across all 50 U.S. states.

Explore a selection of clean power projects that were brought online in 2021 by clicking on the purple circles.

Operating U.S. Clean Power projects

State Level Highlights

Read the article
In the race to a clean power economy, some states lead the clean power transition, while others are catching up.

Cumulatively, the nation increased operating clean power capacity in 2021 by 17%. Alabama, Virginia, and Connecticut had the highest growth rates, and 18 states saw a 20% or more increase in clean power capacity. But one state does it bigger than the rest.

Top States for Clean Power Capacity in 2021

Texas, California, and Oklahoma led the nation in clean power installations in 2021, together installing nearly 12 GW of new capacity. Seven states added more than 1 GW in the year, 16 more than 500 MW, and 34 more than 100 MW.

Top States for Clean Power Additions

Top ten states 2021

Texas led the country in clean power installations in 2021, installing 7,690 MW. California came in second with 2,852 MW installed, followed by Oklahoma with 1,408 MW and Florida with 1,382 MW. In total, seven states installed more than 1 GW of new clean power capacity in 2021.

Texas was the top installer of the year for both wind (3,343 MW) and solar (3,768 MW) and came in second behind California for storage additions (579 MW). California installed 1,371 MW of new storage capacity in 2021.

In 2021, Texas installed enough clean energy to fully power Delaware and Hawaii combined.

Cumulative State Capacity Rankings by Tech

Top states with operating wind technology

Top states with operating solar technology

Top states with operating battery storage technology

Texas ranks in the top two states for cumulative operating capacity across all three technologies. Texas leads the nation by a significant margin in operating wind capacity, while California leads the country in cumulative online and solar and storage capacity.

Annual Land Lease Payments and State and Local Taxes

Land lease payments in 2021 (in millions USD)

State and local taxes paid in 2021 (in millions USD)

Clean power projects contribute directly to local communities through annual tax payments and landowner lease payments. These projects create economic opportunities in the communities that need it most. Land lease payments serve as a drought-proof cash crop that provides a stable income for American farmers, ranchers and private landowners. The tax revenue that clean energy projects bring to communities means new income to repair roads, invest in schools and fund essential services.

Nearly 80% of U.S. clean power capacity is installed in low-income counties, and approximately 64% of land-based wind, solar, and battery storage capacity under construction or in advanced development is located in low-income counties.

In 2021, the clean power industry paid an estimated $1.2 billion in state and local taxes, and nearly $1.3 billion in land-lease payments to landowners across the U.S.

Clean Power Manufacturing Capacity

Manufacturing Capacity

As the most mature clean power sector in the U.S., there are over 500 wind-related manufacturing facilities in the U.S. providing major components such as blades, towers, and nacelles. Hundreds of smaller manufacturers provide other components such as coatings, lubricants, and other materials.

The 60+ solar-related manufacturing facilities in the U.S. include 11 module manufacturers and 20 racking manufacturers. There are also nine major battery manufacturing facilities across the country. As the solar and battery storage supply chains continue to grow, more manufacturers of these components will begin to develop.

Industry Headwinds

Read the article
Unrelenting challenges from the COVID-19 pandemic, the global supply chain crunch, and unnecessary policy uncertainty slowed U.S. clean power growth in 2021.

Roughly 10 GW of clean power capacity originally expected online in 2021 was delayed, in some cases indefinitely.

In the context of our country’s climate targets, clean energy deployment needs to scale much faster. Maintaining last year’s project volume would provide only 35% of what’s needed to reach a net zero grid by 2035. The climate crisis gets more urgent by the day, and these challenges need to be faced directly and swiftly.

Project Pipeline Delays

2021 Installations

Graphic image representing the expected installations, actual installations, and the 9,846 MW difference, which is enough to power 2.2 million homes.

Over 9.8 GW of clean power projects expected online in 2021 were delayed to 2022 or later. Slightly more than half of those projects were solar. There are numerous reasons for these delays, including policy uncertainty and the hold up of the climate and clean energy legislation Congress, long interconnection queues, and supply chain disruptions.

Transmission

Not enough transmission is being built to support the energy transition. In 2021, utilities and transmission developers only add 386 miles of new transmission to the country’s grid. That’s way down from an average of 1,800 miles per year over the last decade. And only 5,000 miles is on-track for delivery between now and 2025.

Transmission is critical to maintain a reliable electricity grid and to more efficiently and effectively integrate renewable energy
resources. Recent transmission additions are not adequate to enable the clean energy transition.

Interconnection queues

While wind, solar, and battery storage projects make up the vast majority of projects in interconnection queues, delays in the interconnection process slow clean power development.

Graphic charts representing projects in the U.S.

Hybrid projects have become increasingly prominent in the interconnection queue, making up 32% of all capacity in the queues across the U.S., while standalone solar projects represent roughly 28%. Solar combined with battery storage are the most popular, accounting for 90% of hybrid projects in the queues.

In particular, CAISO and non-ISO West ques are dominated by hybrid solar plus battery storage projects. This is most likely driven by the fact that both regions already have a high solar penetration rate and developers are seeking to shift electricity generated by solar to other periods of the day.

Solar makes up the majority of the queue in MISO and a plurality in PJM and ERCOT, while wind makes up the majority of the queue in NYISO and NE-ISO, primarily due to offshore wind projects.

The dominance of clean power technologies in interconnection queues is a promising indicator of future power developments, but the process needs work to meeting growing demand for renewables.

Cost of Clean Power

Levelized cost of energy

While the rate of cost reduction slowed for wind and solar in 2021 due to increasing capital costs, wind and solar remain the lowest cost new power sources. As generation technologies that do not rely on fuel to produce electricity, technological advances that lead to falling turbine and solar module costs translate quickly to reductions in the Levelized Cost of Energy (LCOE). LCOE is the lifetime price level that developers & owners of renewable energy projects need to secure to cover project and operational costs and receive a reasonable profit margin for their work bringing the project to market.

The LCOE of wind turbines has dropped 47% since 2012, while solar’s LCOE has declined 71% due to improved efficiencies and technological advances. Offshore wind has similar advancements, with LCOE decreasing by 45% since 2013.

Nonetheless, power purchase agreement prices are on the rise. According to findings from a LevelTen survey, PPA price volatility (PPA prices have increased in 2021) is being fueled by long grid connection timelines, high costs of grid updates, supply chain challenges, and product availability.

Looking ahead

Looking into 2022 and beyond, inflation, supply chain issues, and the uncertainty of tax policy and lack of predictable regulatory action for renewable energy are all expected to have a concerning impact on our ability to deliver growth. Further, continued and arguably heightened uncertainty brought about by challenges to existing trade precedent – like this year’s Department of Commerce inquiry into solar module tariffs – are already taking a toll. Previously expected to experience robust growth, utility solar now faces modules shortages and trade risks that are delaying projects or even causing them to be canceled. At a time when every MW of clean energy is crucial to protect Americans’ pocketbooks, drive economic growth, and achieve the country’s climate targets, these unnecessary barriers are slowing progress.

Clean Power Purchases

Read the article
For the first time, corporate buyers and non-utility purchasers announced more new clean power purchase agreements than all utilities combined.

With almost 13 GW of power purchase agreements, corporate buyers also help set a new annual power purchase agreement record in 2021.

Power Purchase Agreements

Top companies by announced Power Purchase Agreements (PPAs) in 2021

For the first time, non-utility customers led Power Purchase Agreement announcements in 2021, accounting for 57% of clean power purchase announcements. Amazon, Meta and TotalEnergies were the largest corporate purchasers of clean energy in 2021.

Commercial and Industrial Purchasers of Clean Power

Top 10 commercial and industrial purchasers of clean power

Commercial and industrial customers have committed to purchasing over 47,800 MW of clean power (not limited to just power purchase agreements). Of that, almost 65% is operational and is already providing clean power to these companies’ operations. The remaining capacity is still under development.

Top ten overall purchasers of Clean Power

Entities looking to use the clean power have two options: own clean power projects or buy clean power via offtake agreements. The companies listed in the chart above either own or purchase the most operating clean power in the nation. Investor-Owned utilities top this list, though public utilities and commercial entities are beginning to become more prominent.

Climate and Health

Read the article
Clean energy sources are key solutions to reduce greenhouse gas emissions and combat climate change.

When generating electricity, wind and solar power produce zero carbon emissions. That means a cleaner and healthier environment for Americans.

Benefits of Clean Power

Carbon Emissions

0 metric tons

Carbon dioxide emissions when wind and solar generate electricity

399 million metric tons

Carbon dioxide emissions avoided per year with current U.S. wind and solar power

$18 - $47 billion

Economic value of health benefits from emission reductions from current clean power generation

Clean Power Technologies

Read the article
Scalable clean power technologies, like wind, solar, and battery storage, have continued to improve in their efficiency and drop in cost, leading to deployment across the 50 states.

Battery Storage and Hybrid Projects

Battery Storage Capacity

2021 was the largest year on record for battery storage installations. In 2021, 2,695 MW and 7,774 MWh of battery storage capacity came online. This is a 200% or 331% increase from 2020 installations. About two-thirds of the battery storage projects installed in 2021 were part of hybrid projects. Cumulative online battery storage capacity is now over 4,700 MW and 11,300 MWh. For scale, 69% of total capacity online and 69% of total energy capacity online was installed over the past year.

Hybrid Project Operational Capacity

Operational Hybrids

As the cost of energy storage has continued to decrease, hybrid projects, which pair together wind, solar, or storage, have become more common. In 2021, 3,364 MW of new hybrid capacity came online. Almost all of that capacity came from solar + storage projects. In total, there is over 10.9 GW of hybrid project capacity online in the U.S..

Land-Based Wind Power

Graphic image depicting the increase in size of wind turbines from 2001 to 2021.

Over the past two decades wind turbines have increased their rotor diameters and hub heights, which has in turn increased nameplate capacities. The average hub height of turbines installed in 2021 reached 91 meters and the average rotor diameter spanned 125 meters. The average wind turbine size increased in 2021 to 2.9 MW, up from 2.7 MW last year.

Wind projects online

U.S. map of wind projects online in 2021 and wind projects online before 2021.

The 13,400 MW installed in 2021 brought the U.S. to 135,843 MW of cumulative operating capacity. Many of these wind projects are concentrated in the central plains of the U.S. where world-class wind resources are located. Cumulative operating wind power capacity stood at 135,843 MW as of the end of the year.

Offshore Wind Power

U.S. offshore wind accelerated forward in 2021, as the first two domestic offshore wind turbines located in federal waters completed construction and started delivering electricity to the grid.

Offshore wind procurements

In March of 2021, the Biden Administration announced a goal to deploy 30 GW of offshore wind by 2030. The nearly 8.5 GW of offshore wind procured in 2021 was an important step towards meeting that goal. Total offshore wind procured through 2021 sits at nearly 17.5 GW

Solar Power

In 2021, solar power developers brought online 424 utility scale solar projects totaling 12.3 GW. These projects were spread across 36 states, including six states that added 500 MW or more. Texas led all states in new solar power, installing nearly 3.8 GW. California followed with nearly 1.2 GW and Florida placed third, adding just below 1 GW.

Total Utility-Scale Solar Capacity

Operating Utility Solar Power by state (MW)

Operating cumulative utility scale solar reached 60,733 MW at the end of 2021. Solar capacity spans across 47 states, the District of Columbia, and Puerto Rico. Only Alaska, North Dakota, and West Virginia lack utility scale solar plants. California, with its supportive solar policies, array of solar resources and large population, continues to lead solar operations with 15,016 MW. Texas comes in second with 8,500 MW taking lead from North Carolina with 5,594 MW, followed by Florida (4,839 MW), and Nevada (3,128 MW).

Need more data? Become an ACP member to gain access to more business insights

An American Clean Power membership unlocks access to exclusive resources such as this report. The free public version of the report, which provides a summary of key takeaways and graphics from the full report, is available for download.

However, the full Clean Power Annual Market Report 2021 is available for members only. Not a member? Join now.