Using Data to Decode Site Safety
This week marks ACP’s 2023 Operations and Maintenance and Safety (OMS) Conference in Orlando, Florida. This conference is the place where industry leaders, experts and external stakeholders meet to discuss the latest health and safety, operations and maintenance, training and development, and quality assurance conversations that will be critical as we prepare for the expansive future of the clean energy workforce. View the full OMS agenda to learn more.
Keeping our workforce safe on the job is the clean energy industry’s top priority. ACP Conferences like OMS unite members who are leading the charge into the future of safety in the industry using cutting-edge technology and techniques. OMS 2023 Exhibitor Invenergy Services details one of its recent findings regarding site safety:
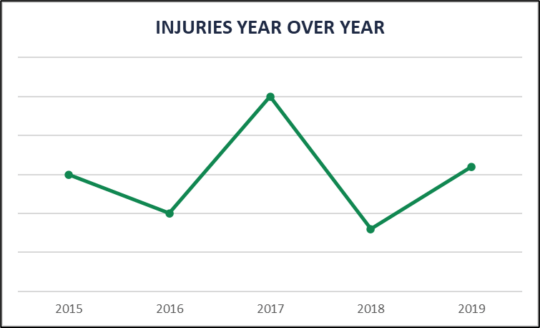
A few years ago, Invenergy Services’ environmental health and safety (EHS) team approached its operations engineering team with a challenge: They noticed a cyclical pattern in injuries year-over-year from 2015 through 2019 and hoped our performance analytics team could utilize our operational data analytics tools to investigate.
To begin, we asked: How can we apply data science methods to better understand factors that impact our safety performance?
Over the past few years, the clean energy industry has put great emphasis on improving safety cultures at each site, tracking metrics, collecting safety data, and communicating the importance of safety. At the same time, improvements in data science applications when applied to operating assets have proven to reduce operating expenses. By combining these two trends, we can use data science applications and machine learning tools to analyze safety data at a more granular level to improve the health and safety of all those working in this industry.
To begin our analysis, we compiled safety data, as well as each site’s operational data, including work management and labor hours on a monthly level. This allowed us to start looking at trends and correlations month over month. We found that incidents were slightly seasonal even when the data was normalized by workload. Additionally, we found some variables that were related to increases and decreases in safety incidents. We used these trends to gauge reporting culture at each of our wind sites. But we did not stop there.
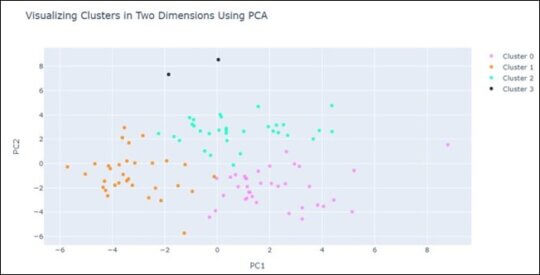
We went back to the EHS team with our findings and decided to dig deeper to include site technicians’ daily schedules and workloads in our analysis. Analyzing this data at a daily level, we looked at the number of technicians who were injured, technicians who weren’t, and compared their workloads each week. Using a clustering algorithm, this new data led us to identify three different categories of technician injuries. The purple cluster (shown on the chart below) are injuries possibly impacted by fatigue. These technicians had a higher workload than average on the day of injury and in the days leading up to the injury. The green cluster represents possible “opportunity.” These were technicians with a high workload on the day of the injury, but not in days leading up to it. And the orange cluster represents injuries with no obvious factor behind the injury.
By applying data science techniques to safety data, my team was able to dig into extremely large quantities of safety and operational data to draw conclusions about injury patterns and implement multiple solutions. Some of these solutions include Hazard Hunt Thursdays, which encourage sites to identify potential hazards, higher-quality safety observations, and regular communication between EHS and my data science team.
But the most important takeaway is that analyzing safety data is an important way to identify and address risks and hazards before they become injuries. Analytics has many future implications for managing risk metrics that will be important to the clean energy industry. Often, we are focused on predicting and preventing major component failures but applying the same practices to analyzing safety data could have significant benefits for injury and even fatality prevention. As machine learning tools evolve, it is important that our industry remains committed to utilizing them for the improvement of safety practices. As my team has shown, while we’ve historically applied these tools to operational data, there are valuable takeaways and improvements that come from analyzing safety data, too.
This is a guest blog post from ACP Member Invenergy Services. To learn more information on how to become an ACP member, please visit our membership page.