Clean Energy in America Reaches Milestone in 2021, But Installation Pace Must Accelerate to Reach Emissions Goals
The quarterly results are in: utility-scale solar and battery storage set annual installation records in 2021, according to the American Clean Power Association (ACP)’s newly released Clean Power Quarterly Fourth Quarter 2021 Report.
While clean energy capacity passed the major milestone of 200 gigawatts (GW) – enough to support the energy needs of almost 2 out of every 5 American homes – the pace of clean energy installation risks hitting a plateau, with significant project delays due to supply chain bottlenecks and policy headwinds. Despite impressive year-end numbers, the amount of clean energy installed this year is just 45% of the clean power capacity needed this year to stay on track to meet our country’s emissions targets.
Below, we look at the Top Five Takeaways in clean energy from the last quarter of 2021:
1. Over 200 GW of Clean Power Capacity Online
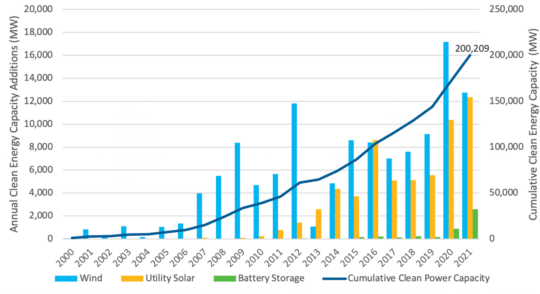
There is now 200,209 megawatts (MW) of operating clean power capacity in the United States, enough to power the equivalent of 56 million American homes.

The U.S. clean energy industry installed 27,723 MW in 2021, after adding 10,520 MW in the fourth quarter. This new clean power represents over $39 billion in infrastructure investment.
While this was the second-best year on record for clean energy installations, modeling suggests that over 60 GW was needed in 2021 to stay on pace to meet our country’s goals for a zero-emissions grid by 2035.
Total annual installs fell 3% compared to 2020, due to over 13.2 GW of projects originally expected to be online in 2021 slipping to 2022 or 2023.
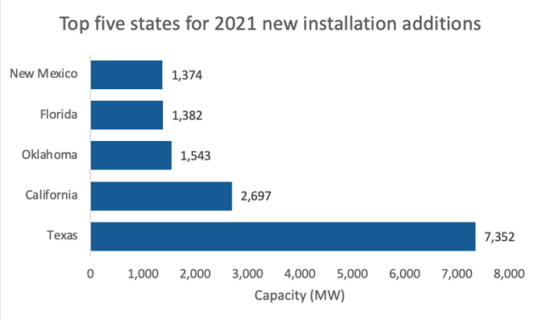
Project owners commissioned 606 new project phases in 43 states and DC in 2021, including 168 new phases in the fourth quarter. A long-time clean power leader, Texas led with 7,352 MW installed in 2021, followed by California (2,697 MW), Oklahoma (1,543 MW), Florida (1,382 MW), and New Mexico (1,374 MW).

Over 5,400 MW of land-based wind capacity came online in the last three months of the year. In 2021, wind installations totaled 12,747 MW. The solar industry added 3,937 MW in the fourth quarter and 12,364 MW total in the year. Battery storage installations ramped up in the fourth quarter to 1,173 MW—the first quarter ever with battery storage installations over 1 GW. For the full year, battery storage installations totaled 2,599 MW, outpacing 2020 by over 1.7 GW.
2. Significant Project Delays
In the fourth quarter, project owners and developers reported over 13.2 GW of delayed project capacity where the expected commissioning date was moved back. Delays are due in part to supply chain issues impeding project timelines, rising costs pressuring project economics, and long, slow interconnection queues. Almost half (48%) of the delayed clean power capacity was solar, while 42% was wind, and 10% was battery storage. For the solar sector, delays were due mainly to trade policies and lack of regulatory certainty impacting the availability of solar panels coming into the country, while the wind sector faced policy uncertainty, including the expiration of tax credits for wind projects.
Over 11,440 MW of capacity that was expected online in 2021 was delayed. 7,990 MW was delayed to 2022, in many cases to the first quarter of the year. 653 MW is now expected to come online in 2023, and 180 MW in 2024. 2,202 MW were indefinitely delayed. Projects with expected commissioning dates in 2022 and 2023 were also impacted. Over 1,250 MW of clean power capacity that was excepted online in 2022 was delayed to either 2023 or 2024, and 580 MW expected online in 2023 experienced delays.
Additional policy work to invest in clean energy and create stable tax policies will help the industry deploy these crucial clean energy projects, create more American jobs, and drive more economic benefits to communities across America as we all work toward accelerating our clean energy future.
3. Over 1,000 Projects in the Pipeline Powers Jobs and Economic Growth
The clean power industry is set to play a key role as our country transitions to carbon-free energy sources. At the close of 2021, there are more than 1,000 clean power projects in the U.S. project pipeline. These projects power American jobs and economic growth across our nation. Accelerating the pace of clean energy deployment and providing policy certainty for businesses will help grow our economy, create good-paying U.S. jobs, and meet our nation’s climate goals.
At the end of 2021, the nation’s near-term development pipeline totaled 120,171 MW of capacity, including 37,803 MW under construction and 82,369 MW in advanced development. The clean power project pipeline spans across the country and is comprised of 55% solar, 20% land-based wind, 15% offshore wind, and 10% battery storage.
Texas is the top state in terms of capacity in the pipeline with 19,918 MW, accounting for 17% of the total pipeline. California comes in second with 13,663 MW in the pipeline, then New York with 7,831 MW, Indiana with 5,874 MW, and finally Virginia with 5,836 MW.
4. Record Power Purchase Agreement (PPA) Announcements in 2021
2021 was a record year for clean energy procurement announcements, with corporate and utility buyers alike driving demand for new clean power projects. Power purchasers and project developers announced 5,765 MW of new Power Purchase Agreements (PPAs) in the fourth quarter, bringing 2021 total contracting to 28,126 MW, a record year and a 10% increase from 2020.
Corporate customers signed up for 1,871 MW of clean power PPAs in the fourth quarter of 2021, bringing total corporate clean power procurement announcements for the year to 11,756 MW. Pfizer was the top corporate offtaker during the quarter, with 310 MW announced. Facebook was the second highest with 285 MW, and PepsiCo third with 72.5 MW.
Utilities made up 35% of announced PPA capacity this quarter, with 20 utilities signing contracts with a total capacity of 1,994 MW. Clean Power Alliance (948 MW), AEP Energy (760), and Central Coast Community Energy (579 MW) led PPA announcements in the utility sector in 2021. Solar was also the dominant technology for utility PPA announcements, accounting for over 70% of capacity announced.
Despite record high demand for PPAs, prices are increasing. Average PPA prices increased 5.9% in the fourth quarter. Year-over-year, the average overall PPA price increased by 15.7%, driven mainly by increases in wind prices (19.2%). Solar PPA prices also rose 12.1% year-over-year, according to data from LevelTenEnergy. PPA prices are rising in part due to supply chain constraints, increasing commodity prices, regulatory and public policy uncertainty, and long interconnection queues.
5. Monumental Projects now Online
Several historic clean energy projects came online across the country in 2021. Pattern Energy’s Western Spirit Wind in New Mexico became the largest project in the country, with over 1.1 GW in in total capacity, along with a 155-mile 345 kV transmission line that will connect new wind power to New Mexico’s grid. According to Pattern Energy, the transmission line will enable over $1.5 trillion of new investment in renewable energy generation and transmission, while also improving grid reliability and bringing hundreds of construction jobs to the state.
Florida Power & Light (a subsidiary of NextEra) brought the Manatee Solar Energy + Storage Center online, making it the largest solar-connected battery facility in the country. The Florida-based project includes 74.5 MW of solar capacity and 409 MW (900 MWh) of battery storage capacity. Two storage phases, totaling 130 MW, at NextEra’s California-based Blythe project came online in 2021. The project has an existing solar capacity of 393 MW, making it the largest solar + storage project operating in the country. Moss Landing, which had its first phase come online in late 2020 and second phase in 2021, is the largest stand-alone battery storage project in the country with a total capacity of 400 MW or 1,6000 MWh.
ACP continues to closely track a wide range of market activity across the clean power sector and provides key data and context in its quarterly reports. Underlying data can be accessed with CleanPowerIQ, ACP’s proprietary flagship data product.
ACP Members can dive into more market data and trends from the quarter by downloading the full Clean Power Quarterly 2021 Q4 report on our website. To gain access to all of ACP’s member resources, inquire about becoming a member on our website.

