Beating the projections: Future wind costs 50 percent lower than predicted five years ago
Five years ago, a survey led by Lawrence Berkeley National Laboratory (Berkeley Lab) asked many experts about the future of wind power and cost trends. Once again, the industry has beaten the projections– cost reductions since then have dropped much faster than predicted. New estimates of future costs are half what global wind experts predict predicted just five years ago, with sustained cost reductions across all wind power sectors. Current cost and expected future costs if realized will mean wind will play a larger role in global energy supply and energy-sector decarbonization than previously anticipated, which has big implications for modelers, analysts, investors, planners and policymakers.
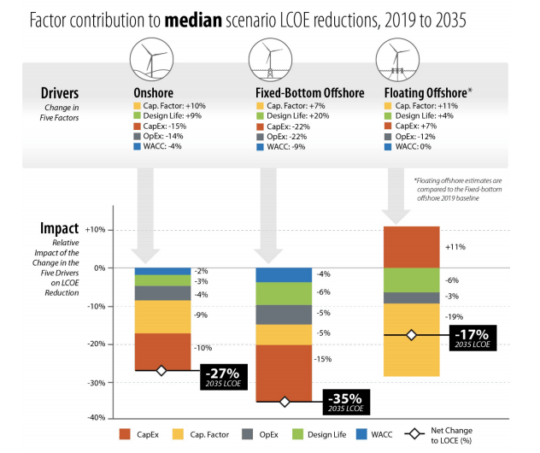
The new LBNL study summarizes a global survey of 140 wind experts on three wind applications – land-based wind, fixed-bottom offshore wind, and floating offshore wind. Experts anticipate under a “best guess” (or median) scenario of the levelized cost of energy (LCOE) decreasing 17 percent-35 percent by 2035 and 37 percent-49 percent by 2050, driven by bigger and more efficient turbines, lower capital and operating costs, and other advancements. On a percentage basis, floating offshore costs declines fastest, then fixed-bottom offshore, then land-based. Uncertainties remain: under a scenario that reflects enhanced advancements, experts predict even greater reductions of 38 percent–53 percent by 2035 and 54 percent–64 percent by 2050.

That means a power source that’s already the lowest-cost source of new electricity in many parts of the country is about to get even more affordable.
Technology drivers behind new cost reductions
There are five key factors that impact the LCOE: upfront capital cost, ongoing operating costs, capacity factor, project design life, and cost of financing. Experts anticipate continued improvements across all dimensions, with the relative contribution varying by wind application.
A key driver in these improvements is turbine size. For land-based wind, growth is expected not only in generator ratings (to 5.5 megawatts [MW] on average in 2035, up from 2.5 MW in 2019) but also in two other factors that increase capacity – rotor diameters and hub heights. Offshore wind turbines are expected to get even bigger, to 17 MW on average in 2035, up from 6 MW in 2019. Floating offshore wind is anticipated to gain market share, growing from its current pre-commercial state and accounting for up to 25 percent of new offshore wind projects by 2035.
Wind turbine prices have been steadily decreasing, but lower turbine prices are only one factor driving down wind power costs. Improvements in energy output, project life, operational expenses, and cost of finance all contribute. Forecasters that only consider CapEx will, at best, capture 45 percent of the cost reduction opportunity.
Beyond costs: considering grid system value
As costs decline, additional focus may turn to the value of wind in energy markets, and to the many barriers that hinder deployment; wind plant design and operation will both increasingly consider not only levelized costs but also grid value and deployment barriers. With respect to turbine size, growth constraints are primarily related to transportation and logistics and, for onshore wind, permitting and community acceptance (design and materials are viewed as less constraining). For land-based wind, a substantial percentage of experts anticipate significant use (over 10 percent of projects) or even widespread use (over 50 percent of projects) of many grid-system value-enhancement options: large rotors, hybridization with storage, curtailment for revenue maximization and life extension, and more. For offshore wind, top-rated value enhancement options include larger rotors, provision of balancing services, interconnection to increase grid value, and hybridization with storage and hydrogen production. All these trends will enable wind to play a larger role in global energy supply than previously thought while facilitating energy-sector decarbonization.
For more information, click on this link to access the report’s landing page, which includes a two page fact sheet, a summary Power Point slide deck, and a pre-print version of the article that will be published in the journal Nature Energy.

