
The main reason wind energy output appears lower in 2015? 2014 was a record high wind year
2014 saw record high wind output in the U.S., most notably when wind energy provided large amounts of extremely valuable power that helped keep the lights on during extreme cold in January 2014. However, the downside of 2014’s record high output is that it makes 2015 wind output appear to be drastically lower. Several recent news articles have used the comparison against 2014 output to build the narrative that 2015 wind output has been concerningly low.
While the first half of 2015 has seen below average wind speeds, a more meaningful comparison against a longer-term average shows 2015 wind output to be within the normal bounds of inter-annual wind output variation. Moreover, several months of below average wind output are not a reason for concern, as they fall within the band that grid operators and power plant investors expect because many sources of energy experience variability in fuel supply.
The EIA data in the table below show that the first six months of 2014 and 2015 both depart from the more typical wind output in 2013, with 2014 being a few percentage points higher and 2015 a few percentage points lower. Moreover, each datapoint covers only a narrow six month period, and the anomalies seen during those periods were offset by more normal levels of wind output during the latter six months of the year, as shown in the chart further below and as one would expect due to the statistical principle of regression toward the mean.
| Time Period | First Half 2013 | 1H 2014 | 1H 2015 |
| Wind fleet capacity factor | 36% | 38% | 33% |
With that full context provided, it is clear that a few percentage point difference in wind output over a few months is not a reason for concern. However, if one focuses solely on the change from 1H 2014 to 1H 2015, as several recent articles have done, then one can get the mistaken impression that the wind output seen during the first few months of 2015 is a cause for concern.
The green line in the chart below shows that the wind resource was extremely high in 2014, significantly higher than any other year in the last 15 years. Even 2013 fell in the top four wind resource years over the last 15 years, so 2015’s wind output would look even less unusual if it were compared to a more typical year than 2013 in the table above.
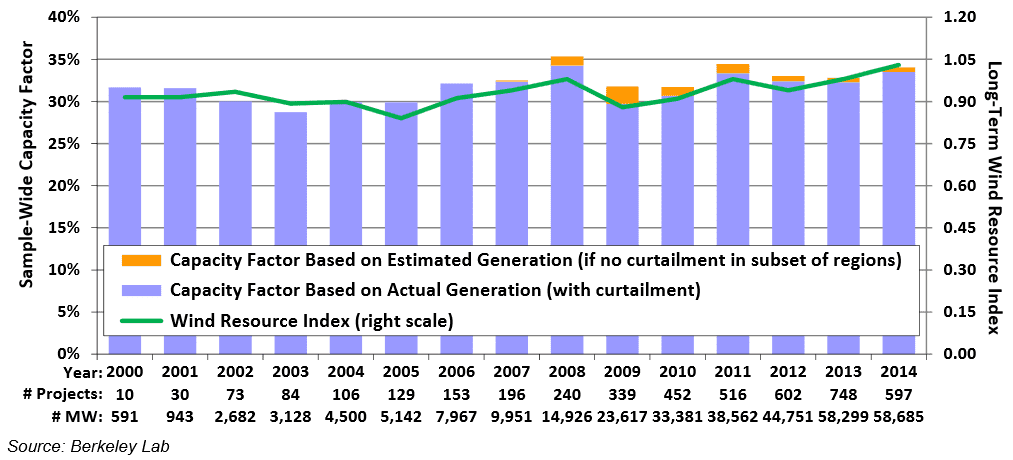
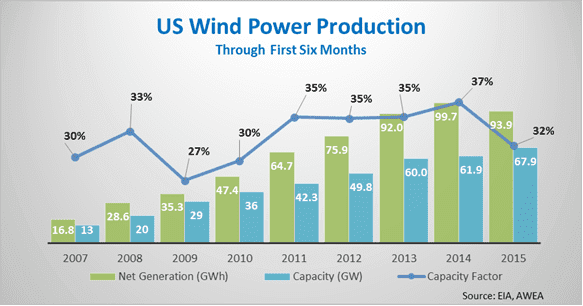
The following chart shows that the average capacity factor for the first half of 2015 is still higher than that seen in the first halves of 2007, 2009, and 2010, based on an estimate calculated from EIA capacity and January-June generation data for all U.S. wind projects. In addition, total wind energy production in the first half of 2015 is higher than that seen in the first half of any year except 2014.
Inter-annual variations in wind output are not a concern, as variability in fuel supply affects nearly all sources of energy. Last year one-third of Midwest coal plants had their fuel supplies curtailed due to railroad constraints, while natural gas pipelines experience congestion or even supply shortages. Natural gas prices have varied by a factor of five over the last 10 years due to fluctuations in supply and demand, resulting in large fluctuations in electricity prices and consumer costs. In contrast, wind plants have no fuel costs, so utilities that diversify their fuel mix with stably-priced wind protect their consumers from electricity price volatility. In addition, all power plants experience failures from time to time, which are a far larger cost for grid operators than the gradual and predictable changes in wind energy output. As another example, the hydropower resource varies more from year to year than the wind resource, yet the Pacific Northwest has successfully relied on hydropower to provide the majority of its electricity for several generations.
The main reason why the United States built an interstate power system 100 years ago was so that a large number of power plants and sources of electricity demand, each of which is inherently unreliable, could be combined to make a reliable power system.
A strong transmission system plays a key role in accommodating the fluctuations in the availability and price of all fuels. For example, transmission lines like the Pacific DC Intertie in the Western U.S. allow wind and hydropower to be delivered from the Pacific Northwest to California when output is high in the Northwest, while the line can flow in reverse when hydropower, wind, and solar generation is high in California and total generation supply is low in the Pacific Northwest.
AWEA Manager of Industry Data and Analysis John Hensley contributed to the analysis included in this post.