Record August winds propel 2015 output
Year-to-date wind energy production is almost back to the high-water mark seen in 2014 thanks to record output in August and above average output in July, according to newly released Department of Energy (DOE) data. The latest results also confirm that some press articles were premature in their sky-is-falling reports of decreased 2015 output, based on only a few months of data.
When those articles ran several months ago, we pointed out that much of the apparent decline was simply caused by the fact that 2014 had some of the strongest winds on record, so even average wind energy output in 2015 would have looked like a large decline. We also explained that several months of below average wind output are not a reason for concern, as they fall within the band that grid operators and power plant investors expect because many sources of energy experience variability in output.
The latest data confirm that we were right. DOE’s data show August 2015 had the highest wind energy output of any August on record, both in terms of gross wind power production (13,040 gigawatt hours (GWh)) and a capacity factor of 26 percent – a measure of actual generation as a share of the theoretical maximum potential output. The chart below provides a historical comparison of August wind power production in different years, with August 2015 showing a 28 percent increase over August 2014.
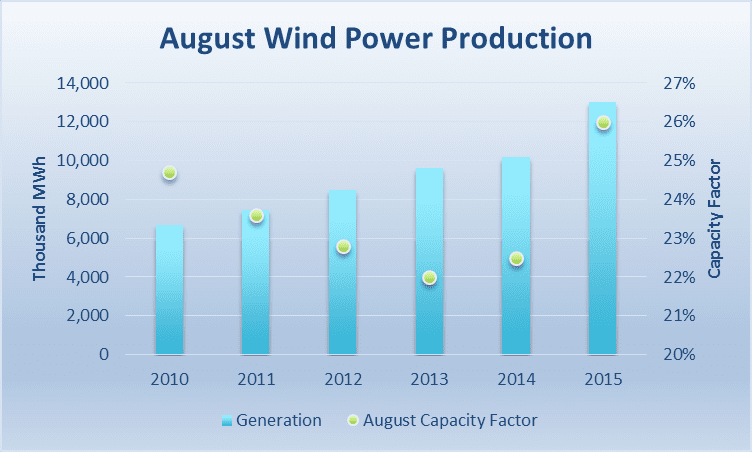
Since this jump in generation is partially explained by the additional wind capacity installed since August 2014 – as you add more wind turbines to the system, generation should rise all else being equal – we must investigate capacity factors to provide a more apples-to-apples comparison. On that count, August 2015 also set a record, with a 15 percent increase in capacity factors compared to August 2014.
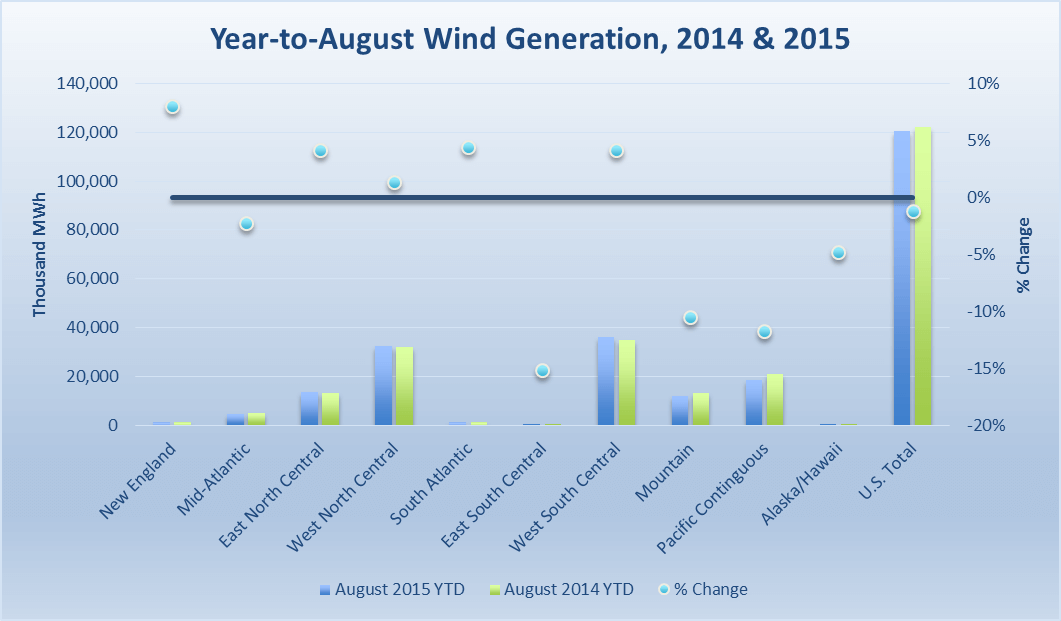
August’s strong performance is helping year-to-date wind power output catch up to 2014’s record winds. Through the first 8 months of the year, wind power production in 2015 is only 1.2% off the record output of 2014. Considering the below average production seen in the first half of 2015, this is an encouraging trend. The chart below depicts a regional and national comparison of January-August 2015 and the same time period in 2014. While some regions continue to experience below average wind production for the year, many of the higher wind resource areas are now trending above 2014 production levels, including parts of the Midwest, the Plains, and Texas.
Above average output in July also helped 2015 recover to 2014’s level. U.S. wind plants averaged a 27.6 percent capacity factor in July 2015, significantly above the level seen the prior two years. July wind generation was 12.6 percent above the level seen in July 2014, larger than the increase in wind capacity over that time period.
Will this upward trend continue? It’s unclear. Vaisala has predicted El Nino will continue to dampen wind speeds through the end of the year, though California and a few pockets in Texas and Indiana are forecasted to experience higher than normal wind speeds. Nevertheless, preliminary indications of strong wind performance in nearly every region in October provide reason for optimism.
Regardless of how 2015 ultimately performs, it’s important to keep in mind that it’s just one data point. Wind power projects are designed to operate for decades, and like many other energy sources inter-annual variability in output is expected by investors and grid operators. For example, last year one-third of Midwest coal plants had their fuel supplies curtailed due to railroad constraints, while natural gas pipelines experience congestion or even supply shortages. Natural gas prices have varied by a factor of five over the last 10 years due to fluctuations in supply and demand, resulting in large variations in electricity prices and consumer costs.
By contrast, wind plants have no fuel costs, so utilities that diversify their fuel mix with stably-priced wind protect their consumers from electricity price volatility. In addition, all power plants experience failures from time to time, which are a far larger cost for grid operators than the gradual and predictable changes in wind energy output. As another example, the hydropower resource varies more from year to year than the wind resource, yet the Pacific Northwest has successfully relied on hydropower to provide the majority of its electricity for several generations.
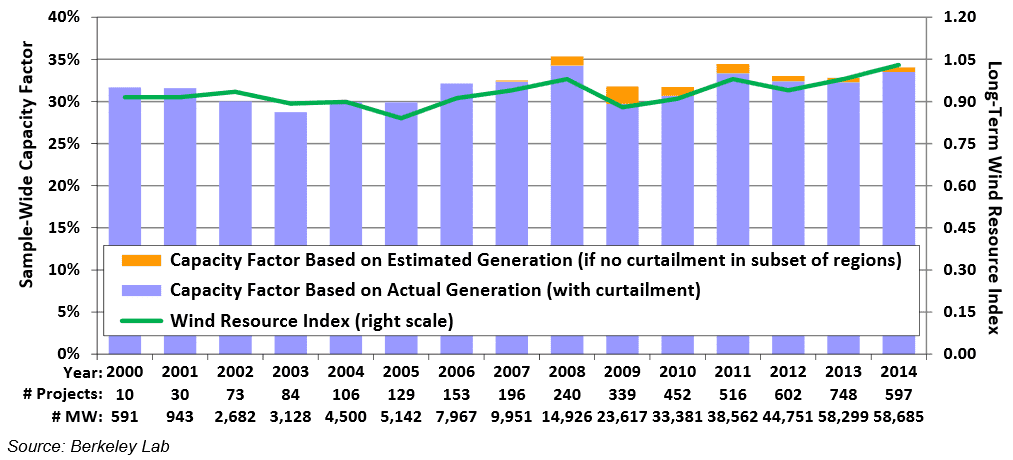
The chart below from the Lawrence Berkeley National Laboratory shows that inter-annual variations in wind energy output are actually quite small. As wind turbine technology continues to advance, we will likely see continuing increases in productivity as wind turbines become ever more efficient at harnessing clean, renewable wind power. This is an American success story we will be telling for years to come.