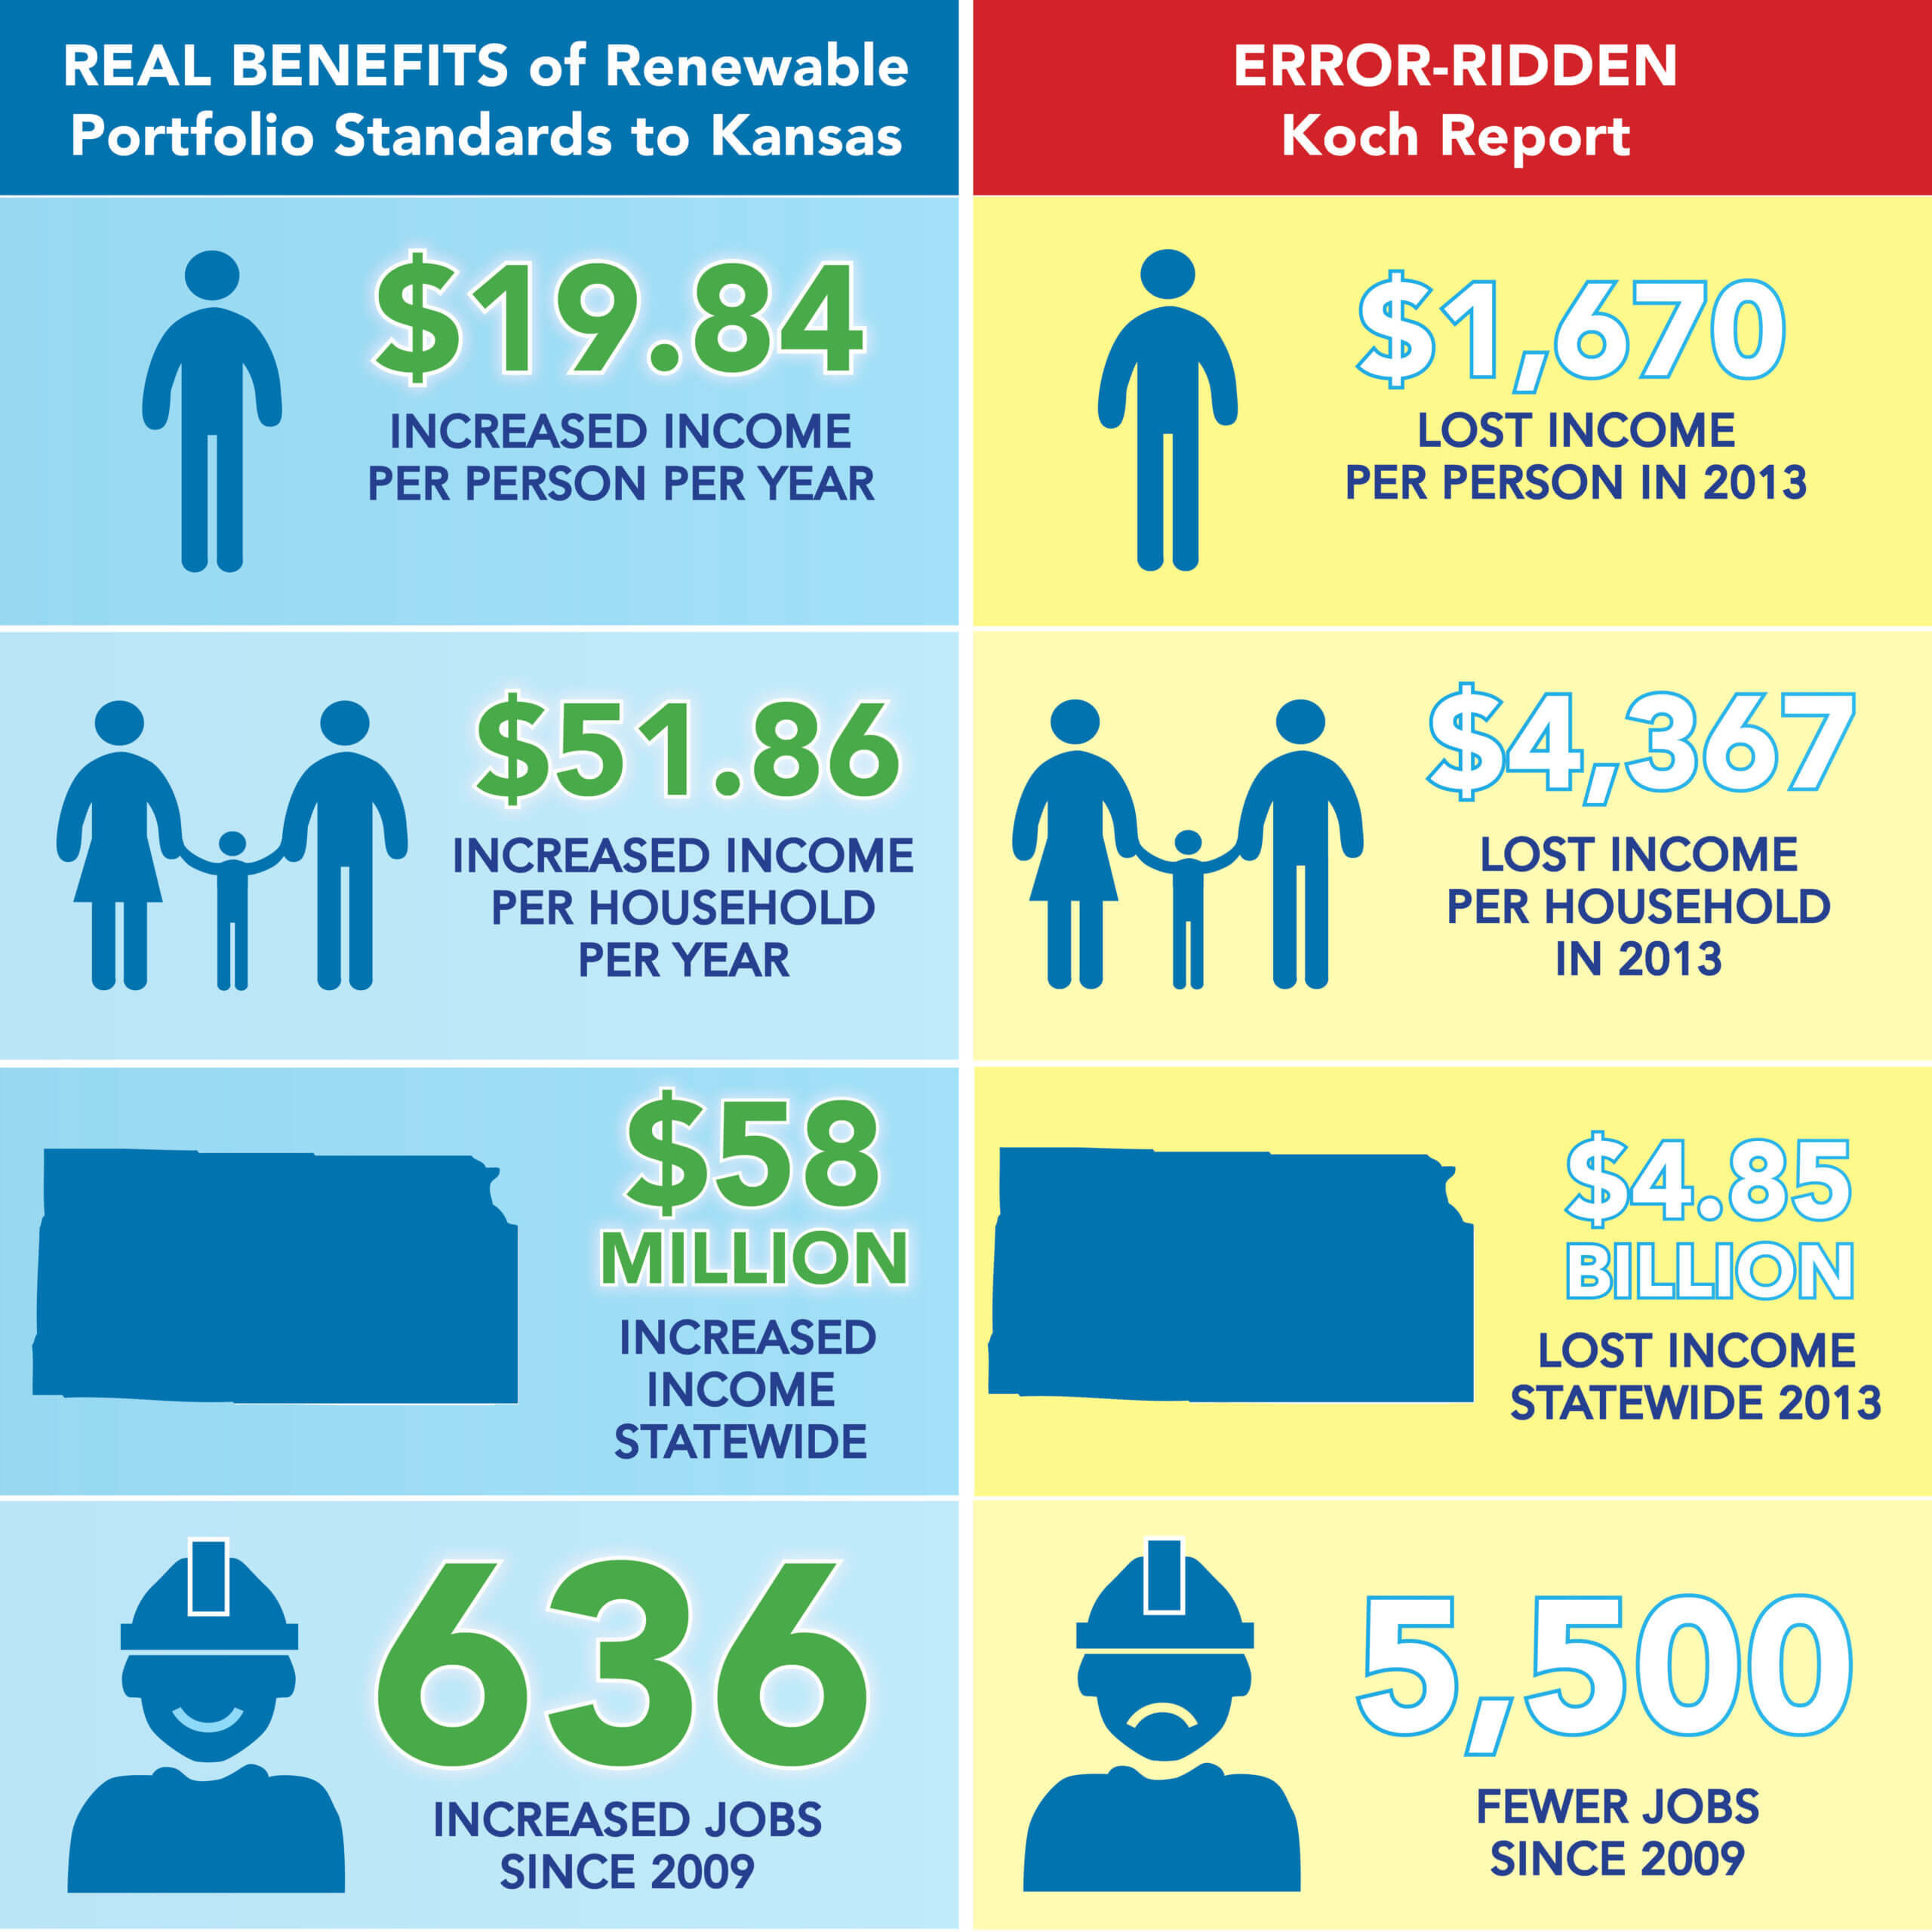
Once errors corrected, Koch Professor’s study shows economic benefits of RPS
Randy Simmons, the “Charles G. Koch” Professor at Utah State University and a major recipient of funding from the fossil fuel industry billionaires, released a study earlier this week attacking the jobs and consumer benefits of state renewable policies in Kansas and elsewhere. When major errors in the study’s methods are corrected, the study’s results actually confirm that state Renewable Energy Portfolio Standards (RPS) like those in Kansas create hundreds of jobs and save consumers tens of millions of dollars.
Study approach 1: When current data on the cost of Kansas wind energy is used instead of obsolete wind cost assumptions, the Koch model shows wind saves consumers millions of dollars and creates jobs in Kansas.
The Koch study’s first method is relatively straightforward. The correction is also straightforward, as all that is required is using actual data on the cost of wind energy in Kansas instead of the obsolete cost assumption used in the Koch study. The Koch study’s use of outdated wind cost data is a great illustration of the maxim “garbage in, garbage out,” as a single incorrect input assumption completely changes the model result.
The Koch study claims that wind energy costs $73/MWh in Kansas, and then argues that this compares unfavorably to the $53/MWh of value that wind energy provides in the region. The only problem with that claim is that wind energy in Kansas costs less than half of what the Koch study claims. Actual market data show that Kansas utilities have signed wind PPAs for under $45/MWh. Additional public data, summarized in the table below, show even lower prices for Kansas wind purchases ranging from $26-36/MWh.

This is confirmed by Oklahoma Gas and Electric, which recently found wind projects in Oklahoma and Kansas offering wind contract prices of “Base pricing averaged approximately $22/MWh,” stating that prices had delcined due to “improved technology resulting in increased capacity factors and reductions in turbine prices.” Comprehensive data collected by the Department of Energy and Lawrence Berkeley National Laboratory confirm this $22/MWh figure, finding this as the average price for wind PPAs in 2013 in the region that includes Kansas. Even if the value of the renewable production tax credit were added back into these costs, the cost of wind energy would still be significantly below $50/MWh. This cost is confirmed by levelized cost of energy figures published by Wall Street investment firm Lazard, which finds wind costs without the PTC are as low as $37/MWh in high output, low wind cost areas like Kansas.
As a result, the Koch attack is turned on its head. Because the cost of wind is lower than the value provided by wind, adding wind reduces electricity prices and helps with economic development and job creation, the opposite of what Koch claims.
In fact, one can then use the exact Koch method to calculate that, at a conservative estimate of current wind costs of $37/MWh, Kansas wind is providing the following benefits by reducing electricity costs:

|
Benefit for Kansas from wind energy |
Value |
|
Electric bill net savings in 2020 |
$43 million |
|
Total electric bill net savings 2015-2020 |
$137 million |
|
Increase in real disposable income |
$58 million |
|
Increase in employment from reduced electricity prices |
636 jobs |
Koch study approach 2: When blatant statistical errors in the Koch study are corrected, the states with the most wind have seen the strongest economic performance.
The top 10 wind states have seen an increase in economic performance of 14.66 percent from 2007 to 2014, while the other 40 states have only seen an increase of 5.54 percent, according to the same index that the Koch study used. This result is widely shared across the top wind states – 8 of the 10 top wind states have seen their economic index grow by 8 percent or more over this period.
How did the Koch study get to a very different answer? By pretending that correlation is causation.
The Koch study only looked at RPS states without comparing their economic performance against states that did not have RPSs. Of the 31 state RPS policies that the Koch study examined, 11 were enacted between November 2006-November 2008, and several more in 2009. During this time, the Great Recession occurred. The study blamed this economic downturn on the RPS rather than the financial crisis.
The chart below shows that economic downturns (measured on the y-axis) typically occurred nearly a year before state RPS policies were enacted (which occurs at point 0 on the x-axis, which is measured in months). The Koch report even acknowledges this fatal problem, noting that “While suggestive, the evidence from the event study warrants further exploration into the effects, since state economies also appear to decline several months prior to the enactment of an RPS.” Unfortunately, the Koch report text quickly sweeps the issue under the rug by moving on without any attempt to address the fatal problem that it is impossible to blame state RPS policies for causing economic downturns that occurred nearly a year before those RPS policies were enacted.
The fact that the downturn precedes the RPS policy in many states makes clear that the recession, not the RPS, was the causal factor.
In fact, the raw data used by the Koch study clearly shows that this is the case. As shown below, all states, not just those with recent RPS policies, experienced a massive economic downturn in the fall of 2008.
The Koch study therefore violates the most basic principle of statistical inference: correlation is not causation. In any science, it is essential that one have a control case against which to measure results.
Our analysis above avoids that methodological pitfall by comparing the economic performance in states with the most wind against states that have less wind. Our analysis also used a consistent time period for all states, so that any lurking variables associated with when RPS policies were implemented are eliminated. Finally, by focusing on actual wind deployment, our method avoids confusion that could be caused by the fact that states RPSs have very different levels of rigor.
Conclusion: Low-cost wind reduces electricity prices, benefiting consumers and the economy
Many other analyses confirm that wind energy provides significant economic benefits. For example:
- Illinois found that wind energy reduces consumer electricity costs by $177 million per year.
- Massachusetts found the state Renewable Portfolio Standard has a 3:1 benefit-to-cost ratio, producing annual net benefits of $217 million.
- Synapse Energy Economics found that doubling wind energy deployment in PJM (Mid-Atlantic and Great Lakes states) beyond existing RPS requirements would save consumers a net $6.9 billion per year, after accounting for all wind and transmission costs.
- Charles River Associates found that a wind and transmission investment in the Southwest Power Pool, which includes Kansas, would provide $1 billion in annual consumer savings and net savings of $628-728 million per year after accounting for wind and transmission costs.
- The New England Independent System Operator’s wind integration study found that 14 percent wind energy reduced electricity prices by around 10 percent, while 24 percent wind energy reduced electricity prices by 15 percent.
- Colorado’s Xcel Energy’s wind purchases were found to save consumers $251 million on net, and additional wind purchases would save a net total of $438 million.
- A recent analysis by AWEA found that wind is providing billions of dollars in gross savings for consumers in Kansas and neighboring states.
Note: A previous version of this blog used slightly different numbers for the Koch study’s claims about the cost and value of wind. Because the Koch authors used a regional name, “SPP North,” that did not correspond to the regional names used in the document they cited to, we assumed they were referring to wind cost and value data for the “Southern Plains” region that was used in the document they referenced. Upon further investigation, we found the “SPP North” terminology used in a different EIA document than the one cited by the Koch authors, and learned that that region corresponds to the Central Plains region, not the Southern Plains. One effect of the change is to increase the economic value of Kansas wind energy by $1/MWh relative to the number we initially used. Our updated understanding of what the Koch study was assuming about the cost of Kansas wind also indicates that the Koch method is more sensitive to changes in the cost of wind than we realized. As a result, once the Koch cost of wind is corrected to actual Kansas wind costs, which indicates the cost of wind is lower than the value it provides, the Koch method shows even larger net economic benefits from Kansas wind than we previously indicated. These corrected net savings figures are included in the table above.


