NERC discloses flawed renewable energy assumptions used in its EPA analysis
Based on the recently released assumptions of a report by the North American Reliability Corporation (NERC) on the Clean Power Plan, it is clear that flawed assumptions led it to overestimate the difficulty of meeting the Environmental Protection Agency’s Clean Power Plan.
While NERC’s April 21 analysis found the Clean Power Plan will result in achievable changes in the generation mix that are comparable to those already underway for economic reasons, with more realistic assumptions NERC’s analysis would have found the path to Clean Power Plan compliance to be even easier. On May 1, NERC posted information about some of the assumptions that were used in its analysis, and additional information about the renewable energy assumptions was posted on May 4. This information reveals that NERC’s assumptions greatly underestimate the contributions wind energy will make towards meeting EPA’s Clean Power Plan. In particular, greater use of zero-emission, rapidly scalable wind energy would have enabled states to achieve compliance with less drastic changes to their generation mix and avoided concerns about the feasibility of meeting the Clean Power Plan targets in the early 2020s.
NERC’s wind cost assumptions are too high
The May 1 posting revealed flawed assumptions about the cost of wind energy that would tend to limit the deployment of renewable energy in NERC’s analysis. NERC assumed that the capital cost of land-based wind energy would be $1,904/kW for the entire period 2015-2035. In reality, the average installed cost of wind energy was $1,630/kW in 2013, the most recent year for which data has been released. This cost is confirmed by market data analysis released by Wall Street investment firm Lazard, which reports that current wind capital costs are in the $1,400-1,800/kW range.
Wind capital costs are widely expected to decline over time, given the more than 50 percent cost reductions seen over the last five years and continuing technological progress. For example, recent in-depth analyses by NREL and DOE (Appendix H) show continued reductions in capital costs and improvements in wind plant performance through 2030.
However, in addition to assuming costs for wind energy that are too high relative to today’s costs, NERC’s analysis holds future wind energy costs constant at those inflated levels through 2035. In contrast, NERC assumes that more mature technologies, like natural gas combined cycle generators, will see significant cost reductions in the future. Specifically, NERC assumes that gas combined cycle capital costs will fall from $1,042/kW in 2015 to $949/kW in 2020 and subsequent years. In addition, NERC’s assumed heat rate for gas combined cycle generators is significantly better than the typical current state-of-the-art plant.
NERC’s assumptions about wind plant capacity factors (the actual output of a plant compared to its potential output at full capacity) also appear to be too low. NERC assumes that new wind plant capacity factors in the PJM region (called RF in NERC’s spreadsheet) decline from 35 percent in 2016 to 33 percent in 2018 and 32 percent in subsequent years. For comparison, the average capacity factor for wind projects installed in the Great Lakes region in 2012 was 34.5 percent (Figure 36), and wind plant capacity factors are increasing by capturing more wind at higher altitudes. NERC’s assumed capacity factors for the SPP and ERCOT regions were not disclosed as NERC’s model did not build any wind in these regions (as discussed below), despite SPP and ERCOT having some of the highest capacity factor wind resources in the country.
NERC arbitrarily hard-wired renewable deployment at a fraction of historic levels
The May 4th posting revealed even larger concerns about NERC’s assumptions. The renewable energy datasheets reveal that nearly all wind and solar energy deployment in NERC’s analysis was forced in using arbitrary modeling assumptions that are a fraction of historic levels of renewable deployment.
The assumption for total solar deployment starts at 16 GW in 2017 and slowly increases to 25.4 GW in 2030. This level of deployment is incredibly low, as U.S. solar capacity stood at 20.5 GW at the end of 2014, and is expected to grow by 20 GW over the next two years alone.
NERC’s arbitrary wind deployment levels are also very low.
As shown in the table below, on a national basis, NERC assumed wind capacity would grow at a compound annual growth rate of 1.52 percent between 2017 and2030. In contrast, the actual wind capacity growth rate seen over the 2006-2014 time period was 16 times larger at 24.25 percent.
The table below sorts states by the amount of wind installed in 2014, so that you can see NERC’s growth rate was even lower in the states that have seen some of the largest amount of wind deployment to date, such as Oklahoma and Texas. For unexplained reasons, NERC’s growth assumptions were also the lowest in the states that have the best wind resources. Specifically, the six states that account for more than 2/3rds of NREL’s estimate for total national wind resource potential (TX, KS, NE, SD, ND, MT, the states marked with an asterisk below) all had wind growth rates well below the national average, with 4 of those 6 states assigned growth rates of close to zero.
These unreasonable and arbitrary assumptions, combined with the flawed wind cost assumptions described above, severely limited the deployment of wind resources in the states that in reality are likely to provide a large share of wind deployment going forward.
| State | Actual compound annual growth rate for wind, 2006-2014 | Annualized compound annual growth rate allowed by NERC, 2017-2030 | Factor by which NERC underestimated actual growth rate | 2014 wind MW installed |
| Grand Total | 24.25% | 1.52% | 15.9 | 65754 |
| Texas | 22.75% | 0.05%* | 429.3 | 14098 |
| California | 12.08% | 2.45% | 4.9 | 5917 |
| Iowa | 25.37% | 1.64% | 15.4 | 5688 |
| Oklahoma | 27.71% | 0.09% | 303.3 | 3782 |
| Illinois | 54.99% | 2.06% | 26.7 | 3568 |
| Oregon | 27.98% | 1.49% | 18.8 | 3153 |
| Washington | 18.00% | 2.83% | 6.4 | 3075 |
| Minnesota | 16.48% | 5.12% | 3.2 | 3035 |
| Kansas | 29.98% | 0.13%* | 223.4 | 2967 |
| Colorado | 31.46% | 4.07% | 7.7 | 2593 |
| North Dakota | 34.29% | 0.21%* | 164.4 | 1886 |
| New York | 21.41% | 3.97% | 5.4 | 1748 |
| Indiana | Infinity | 1.81% | NA | 1744 |
| Michigan | 121.89% | 1.42% | 85.7 | 1525 |
| Wyoming | 21.94% | 2.80% | 7.8 | 1410 |
| Pennsylvania | 28.61% | -0.56% | Infinity | 1340 |
| Idaho | 37.69% | 0.74% | 50.8 | 973 |
| Nebraska | 35.05% | 1.08%* | 32.5 | 812 |
| New Mexico | 6.36% | 4.93% | 1.3 | 812 |
| South Dakota | 43.66% | 0.97%* | 45.2 | 803 |
| Montana | 20.88% | -1.16%* | Infinity | 665 |
| Wisconsin | 36.73% | 5.23% | 7.0 | 648 |
| West Virginia | 31.30% | -0.76% | Infinity | 583 |
| Missouri | Infinity | 2.22% | NA | 459 |
| Maine | 62.39% | 0.16% | 393.5 | 440 |
| Ohio | 66.33% | -7.47% | Infinity | 435 |
| Utah | 109.23% | 3.66% | 29.8 | 325 |
| Arizona | Infinity | 7.71% | NA | 238 |
| Hawaii | 21.95% | 0.85% | 25.7 | 206 |
| New Hampshire | 87.91% | 0.50% | 175.6 | 171 |
| Maryland | Infinity | 3.45% | NA | 160 |
| Nevada | Infinity | 2.12% | NA | 152 |
| Vermont | 45.12% | 1.17% | 38.7 | 119 |
| Massachusetts | 53.13% | 0.59% | 90.2 | 107 |
| Tennessee | 0.01% | 1.07% | 0.0 | 29 |
| New Jersey | 2.31% | 1.90% | 1.2 | 9 |
| Rhode Island | 38.62% | -4.71% | Infinity | 9 |
These flawed assumptions result in strange results from NERC’s model. As mentioned above, NERC’s analysis predicted no new wind deployment in SPP and ERCOT under the Clean Power Plan, even though these regions currently lead the country in wind deployment and have some of the nation’s best wind resources. This bizarre result was almost certainly driven by the growth rate assumptions of 0.05 percent for Texas, 0.13 percent for Kansas, and 0.09 percent for Oklahoma. In contrast, NERC’s model deploys more than 1,000 MW of wind energy in the Southeastern U.S., a region that has seen only 29 MW of wind deployment to date.
In addition, NERC’s analysis used only slightly different hard-wired renewable deployment assumptions for its carbon case (where there is an implicit price on carbon) and no-carbon case (where there is not). The fact that NERC assumed only small additional renewable energy deployment in the carbon case essentially drove what NERC identified as the “incremental impact” of the Clean Power Plan on renewable energy deployment. The wind deployment level assumed in the carbon case was only 3 GW larger than the no-carbon case, the solar deployment assumption was only 2.5 GW larger than the no-carbon case, and all other renewable resources received the assumption that the carbon case would see no additional deployment. This assumption, combined with the flawed economic assumptions above, essentially hard-wired in the conclusion that renewable energy would not make more than a trivial contribution to meeting the Clean Power Plan.
In reality, renewable energy is well-poised to make major contributions to meeting the Clean Power Plan, particularly in the near-term given wind energy’s low cost and rapid ability to scale up. As NERC noted in its report, wind energy is the quickest to build of all the generation options NERC examined. As a result, greater use of wind energy would have addressed NERC’s concerns about the feasibility of meeting Clean Power Plan compliance targets in the early 2020s (NERC’s analysis also incorrectly assumes that states must meet binding targets in each year over the 2020-2029 period, when in reality states must only ensure that their emissions fall below the required level over the 2020-2029 period on an average basis).
Moreover, greater use of renewable energy would have allowed states to meet the Clean Power Plan with even smaller changes in their generation mixes. Because NERC’s analysis arbitrarily and inaccurately barred large-scale use of the compliance options offered under EPA’s Building Blocks 1, 3, and 4, NERC’s model was forced to almost entirely rely on Building Block 2, coal-to-gas shifting, to comply. This impact was compounded by the fact that using a resource with some emissions, like natural gas, requires a far greater shift in the resource mix than use of a zero-emission resource, like renewable energy or energy efficiency. Specifically, because a MWh of gas generation emits nearly half as much CO2 as a MWh of coal generation, nearly twice as many MWh of coal generation must be displaced to achieve the same level of emissions reductions versus if zero-emission compliance options were used instead.
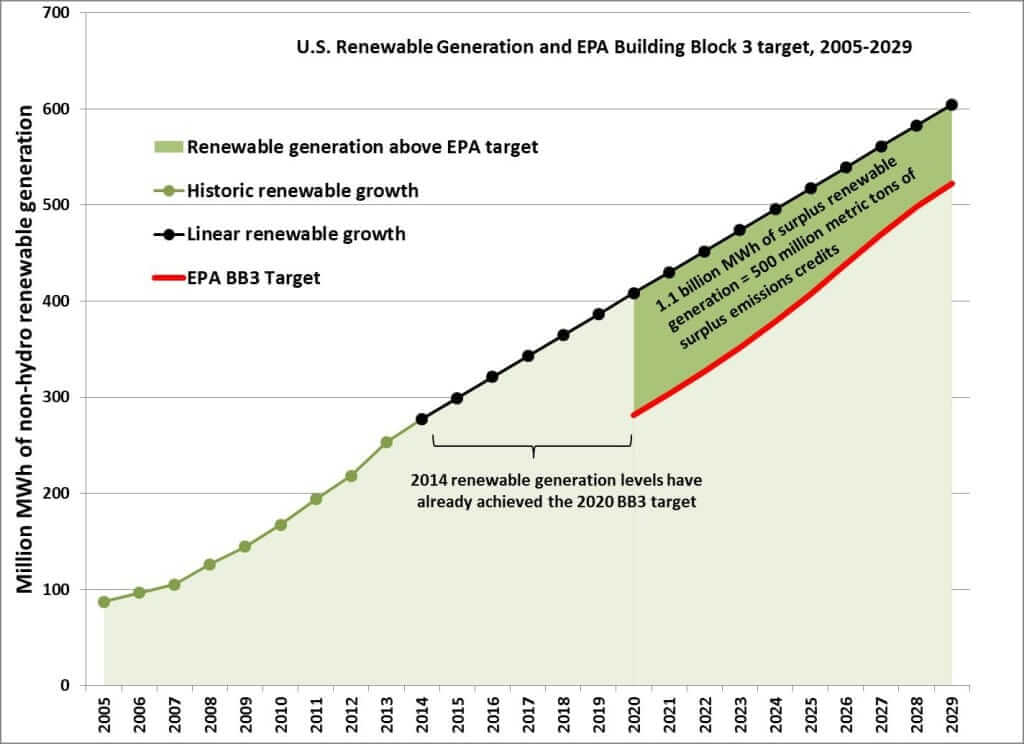
As shown below, wind energy and other renewable resources are on track to more than meet EPA’s targets. In fact, the U.S. has already reached EPA’s 2020 target for renewable energy. The U.S. produced 281 million MWh of non-hydro renewable energy during 2014, exactly meeting EPA’s 2020 target for non-hydro renewable energy generation. Even under the conservative assumption that non-hydro renewable energy continues to expand at the linear growth rate it has experienced over the last 10 years, renewable generation will exceed EPA’s target by 1.1 billion MWh cumulatively over the 2020-2029 compliance timeframe. Because renewable energy growth compounds as the economics of wind and solar continue to improve, and because the growth trajectory for 2005-2014 predates much of the cost reduction-driven growth in wind and solar generation, this linear growth projection is likely to be very conservative.