

Front groups release another garbage in-garbage out study, inadvertently show benefits of wind
Front groups for competing energy sources are attempting the same debunked attack on wind energy for the fifth time, this time with cookie-cutter attacks on renewable energy in a dozen states. The latest reports were paid for by the Interstate Policy Alliance, a hired gun for tobacco companies and other special interests headed by Rick Berman, dubbed “Dr. Evil” by 60 Minutes. The latest attack makes many of the same errors as the previous four attacks, including last year’s attack by the “Koch professor” that resulted in multiple corrections and a disclaimer being added to his attack piece in Newsweek, and coverage of the debacle in the Washington Post.
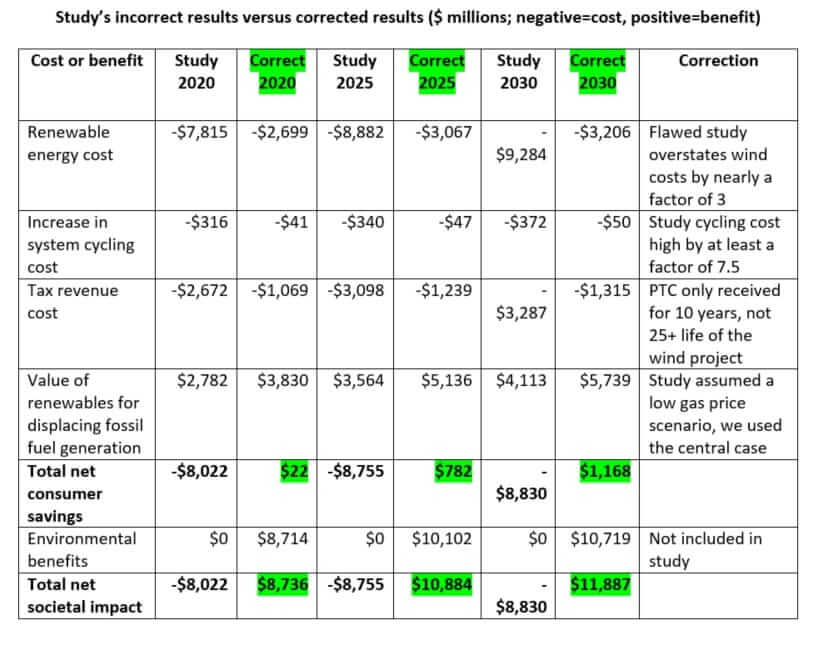
While many of the input assumptions in this attack piece are incorrect, most notably overstating the cost of wind energy by a factor of three, we were able to re-create the analysis using up-to-date assumptions to arrive at the correct results. As with the previous studies, the attempt to attack renewable energy has backfired. Once the errors are corrected, the analysis actually shows that wind energy provides billions of dollars in savings to consumers and creates thousands of jobs, as shown in the following two tables.
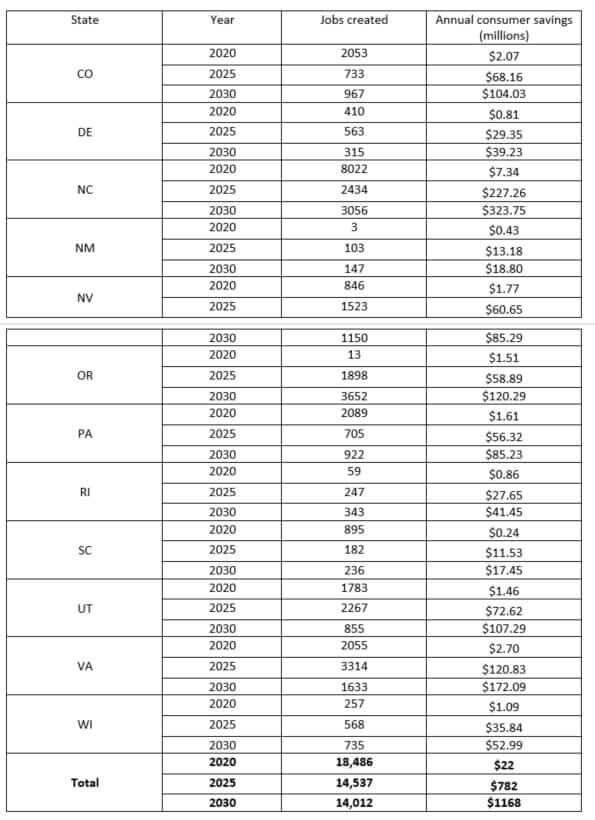
 The consumer savings identified above reduce electricity prices, which in turn creates jobs by reducing industrial energy costs. In fact, the relationship between electricity prices and jobs that the Interstate Policy Alliance report used to allege job losses can be used to calculate the job gains associated with renewable energy reducing electricity costs. These jobs were combined the tens of thousands of jobs created by manufacturing and installing renewable energy, as calculated by the Interstate Policy Alliance study itself, to give total consumer savings and job creation by state.
Net impact of renewable energy on employment and consumer savings, by state
 In the following sections, we explain each of the errors in the study, and how those were corrected.
Study uses out-of-date renewable energy costs and cherry-picks areas with low wind resources
The new attack continues to use years-old estimates of the cost of renewable energy, ignoring the fact that wind energy costs have fallen by nearly two-thirds since 2009. In fact, the new report uses the same obsolete estimate the Koch professor was criticized for last year, and even cites to the previous attacks as a source for its flawed assumptions.
Most notably, the study uses a very old Department of Energy (DOE) estimate for the cost of building a wind project of $2213/kilowatt, even though the updated DOE data for this year shows a cost of $1536/kilowatt. Based on that error alone, the study overstates wind’s current cost by nearly 50 percent.
Another biased assumption is that the study only allows wind energy to achieve 7.7 percent cost reductions over next 25 years. For comparison, wind has achieved more than 60 percent cost reductions over the last 7 years. Our corrected analysis in the table above conservatively uses current costs for deploying wind. If we used third-party projections for future wind energy costs, which foresee continued large cost declines, the consumer benefits of wind energy deployment would be even larger than indicated in the table.
The study also greatly underestimates the productivity of modern wind turbines. It incorrectly uses the average output factor for the total installed fleet of wind turbines operating today, ignoring the fact that wind turbines being installed today are far more productive than those installed five years ago, let alone decades ago. The fleet-wide average output used in the study is significantly weighed down by now-obsolete turbines installed from the 1980s through the 2000s. DOE data show that wind turbines installed in the last two years are about 20 percent more productive than the fleet-wide average assumed by the study, and increases in turbine productivity are expected to continue.
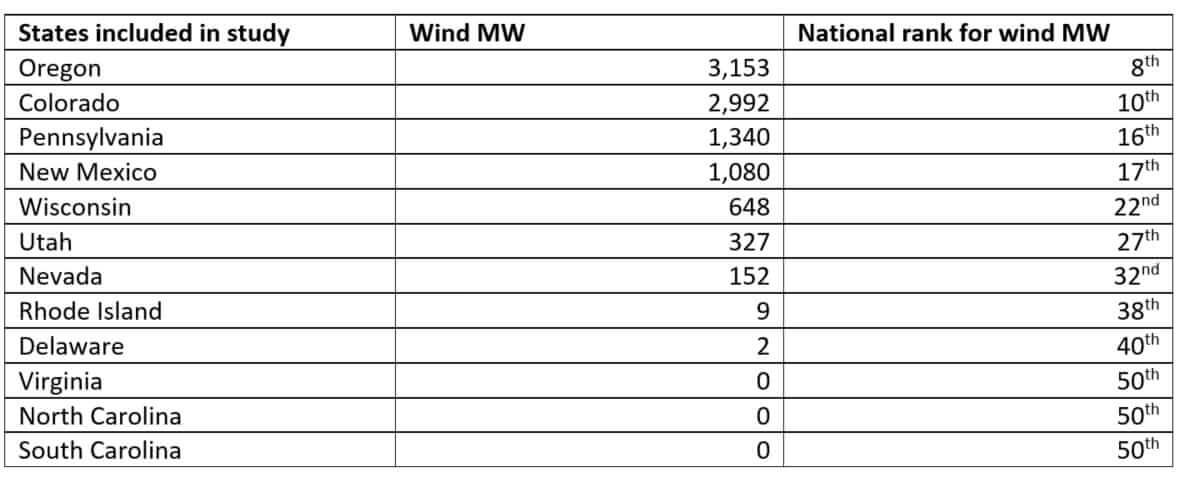
The study also selectively cherry-picked states with below average wind resources. Even though there are 29 states with Renewable Portfolio Standards, the supposed focus of the study, for no apparent reason the study focused on only 12 states: Colorado, Delaware, North Carolina, New Mexico, Nevada, Oregon, Pennsylvania, Rhode Island, South Carolina, Utah, Virginia, and Wisconsin. Notably, this list includes three states with below average wind resources that don’t even have binding RPSs: South Carolina, Virginia, and Utah, two of which have no installed wind capacity.
As one would expect, states with stronger wind energy resources tend to have more installed wind generating capacity, so the study’s cherry-picking of low wind capacity states causes it to underestimate the productivity and economics of wind energy. Of the states included in the study, only Oregon, Colorado, Pennsylvania, and New Mexico have more than 1,000 MW of wind capacity. The study excluded many RPS states with more wind capacity and far more productive and cost-effective wind resources, like California (#3), Illinois (#5), Minnesota (#7), Washington (#9), and even Texas and Iowa (#1 and #2, though their RPSs have been met). Overall, the states included in the study have about half as much wind capacity as the average state, and their wind resources are significantly below average.
Attack study cherry-picked states with below average wind
 The study also assumes that all wind resources will be deployed inside each state, which is particularly punishing because of the cherry-picking of states with below average wind resources. How the author came up with data on wind cost and productivity in states without any wind capacity is also highly questionable. Regardless, the assumption that renewable energy is 100 percent sourced from in-state generation ignores the fact that we have an interstate power system. Wind energy, like all forms of electricity, is commonly purchased across state and even regional lines. Almost all RPS policies count renewable energy delivered from other states, and interstate purchases are widely used to meet those standards. To correct for the study’s cherry-picking and the incorrect limiting to in-state resources, our corrected analysis uses the national average cost of wind energy.
Overall, these corrections reduce the cost of wind energy by a factor of 3 from what was assumed in the study. We were able to back-calculate that the Interstate Policy Alliance study assumes about $68/MWh as the weighted average cost of renewable energy, after the benefit of tax credits. In reality, the average cost utilities paid for wind energy contracts signed in 2014 was $23/MWh. This cost is confirmed by data compiled by Wall Street investment firm Lazard. A Megawatt-hour (MWh) is the amount of electricity produced by a typical turbine in a little over an hour, or enough to power a typical home for roughly a month.
Not only did the study cherry-pick states with below average wind resources, but it also got wind’s costs wrong in above average wind resource states due to the incorrect assumptions about wind’s installed cost and productivity. For example, the study claims wind costs $51/MWh in New Mexico, yet recent wind purchases have been made at around $20/MWh, a transaction the purchaser and state energy regulators note will save consumers around $500 million. As we’ve noted in response to previous attacks, it is ironic that anti-wind groups that claim to support the free market insist on using outdated government estimates for the cost of wind when there is an abundance of real-world market data indicating the cost utilities are currently paying for wind.
Other errors and biased assumptions
– The study uses DOE’s low natural gas price scenario, causing the study to greatly understate the value of wind for displacing fossil fuel use. In fact, the study assumes natural gas is so cheap that the cost of gas generation is lower than the cost of coal generation over the long-term, an unusual result that has only occurred in the real-world during extreme market anomalies. The study argues that using DOE’s low gas price scenario instead of the middle or high price scenario is justified because DOE tends to overestimate future natural gas prices. However, DOE itself acknowledges that the long-term bias in its projections has actually been to underestimate future gas prices 71 percent of the time. Our corrected analysis uses DOE’s middle gas price scenario.
– The study appears to mistakenly assume that the renewable Production Tax Credit is received for the life of a wind project, when in reality it is only earned for the first 10 years of project operations. Our corrected calculations make that adjustment. To be conservative, we did not take into account that economic activity associated with wind energy development produces additional tax revenue that offsets some of that cost. Moreover, the study also incorrectly assumes that the cost of the PTC is borne by consumers in each state, even though in reality it is funded through general federal revenue. We also did not take into account that the PTC is currently slated to phase down for projects installed beginning next year.
– The study also raises common misconceptions about how wind is accommodated on the grid to claim that significant “cycling costs” must be added to the cost of wind. Part of the problem is that the attack piece assumes each state’s power system is operated in isolation. In reality, grid operators aggregate all forms of supply and demand variability across large regions, causing most variations to cancel out and greatly reducing the cost of operating the grid. For example, the attack piece finds a large cycling cost for Wisconsin, but in reality Wisconsin’s power system is part of a large regional grid spanning 15 states. That grid operator has repeatedly noted that the impact of wind energy variability on its system is “little to none.” The study also appears to assume that all fossil power plants remain online and cycle their output down to very low levels, but in reality it is more common for plants to turn off if their output is not needed, incurring lower costs.
Regardless, experts reject the notion that it is possible to assign these costs to any one source of energy, as adding any low-cost source of energy to the power system will cause more expensive sources to cycle their output. However, even if one assumes these costs can be assigned to wind, the costs calculated in the study are 5-10 times higher than those found in the most detailed calculation of cycling costs to date. That detailed study was based on a scenario in which wind and solar provide 33 of the electricity on the grid, a much higher share than any of the standards modeled in the Interstate Policy Alliance attack piece. To be conservative, we included the costs calculated by that study in our corrected calculations above.
Credible studies confirm the net benefits of Renewable Portfolio Standards
Recent analysis by the National Renewable Energy Laboratory and Lawrence Berkeley National Laboratory confirms that Renewable Portfolio Standards provide large net benefits. One study tallied the consumer and environmental benefits of meeting states renewable standards, and found that each MWh of wind energy provides $75 in benefits for human health and the environment by reducing air pollution. We accounted for this benefit in our calculations above.
That study also found that wind provides an additional benefit to consumers by reducing the price of electricity and fossil fuels, beyond the savings from the direct displacement of fossil fuel use, resulting in additional consumer savings of between $13/MWh and $49/MWh. Those billions in additional consumer savings would in turn drive additional job creation. To be conservative we did not include those benefits in our analysis, or attempt to include wind’s additional economic value from reducing water consumption and protecting consumers from fossil fuel price volatility and uncertainty.
The companion study to the benefits analysis examined the cost of meeting renewable standards and found them to be extremely small, a fraction of the costs claimed by the Interstate Policy Alliance attack piece. Notably, this analysis was based on detailed bottom-up accounting of actual cost data compiled by individual states and utilities and recorded in state regulatory proceedings, so it is far more comprehensive than the attack piece’s modeling estimates that are based on flawed assumptions. Moreover, the attack piece’s claims about the cost of renewable standards cannot be correct, as most state renewable standards contain binding cost caps that waive the requirement if the standard causes electricity prices to increase by more than a few percent.
Taken together, these two national lab reports show that renewable standards provide large net benefits to consumers and the environment, with the consumer benefits alone eclipsing the cost of renewable standards. Once the flawed assumptions in the Interstate Policy Alliance attack piece are corrected, it also shows that renewable standards provide large net benefits for consumers and the environment. In fact, once corrected, it shows that renewable standards save consumers billions of dollars and create tens of thousands of jobs.