
Fact Check: Flawed study overstates challenge of integrating wind energy
AWEA’s Celeste Wanner contributed to this analysis.
A national press story recently highlighted an academic study claiming flexible fossil-fired power plants, like natural gas power plants, are critical for integrating renewable energy. In reality, wind energy can be reliably integrated onto the existing power system, and the addition of renewable energy never increases, and actually always decreases, the need for other power plants. Further, the study contains a fundamental mathematical flaw that, when corrected, completely undermines its conclusions.
The facts about how wind is integrated onto the power system
The National Bureau of Economic Research study uses fatally flawed analysis, discussed in detail in the following section, to push the myth that flexible fossil capacity must be added to reliably integrate renewable energy. This argument goes against decades of real-world grid operating experience and dozens of studies showing that wind energy can be reliably integrated onto the existing power system. The addition of renewable energy never increases and actually always decreases the need for other power plants.
The reality is, using wind energy forecasting, changes in wind output are slow and predictable. Most changes in wind output are canceled out by opposite changes in output at other wind plants or the far larger fluctuations in total electricity demand. Because grid operators aggregate all sources of supply and demand variability there is typically minimal increase in the total system need for fast-acting operating reserves as a result of adding wind. Large amounts of wind energy can modestly increase gradual variability on the power system and the need for slower-responding operating reserves, though the cost of those is a fraction of fast-acting reserves.
Overall, at very high renewable penetrations, the impact of wind and solar on total system variability is typically much smaller than that of electricity demand fluctuations and conventional power plant failures. Data from the main Texas power system shows that, even with more than 10,000 megawatts (MW) of installed wind capacity, the integration cost for wind energy is a fraction of that for large conventional power plant failures and electricity demand fluctuations, both on a total and dollar per megawatt hour basis. The Midwest grid operator, which also has well over 10,000 MW of wind capacity, has repeatedly explained that the impact of wind on its need for fast-acting reserves is “little to none.” In addition to the high cost of accommodating the unexpected failures of large fossil and nuclear power plants, analysis has also shown that these inflexible baseload plants impose a large cost and need for flexibility on other power plants.
Importantly, adding wind energy never increases the power system need for capacity (page 2), as this impossibility could only be caused by wind plants providing negative electricity production. It is true that the contribution of wind and solar to meeting the system’s need for capacity is typically lower than that of other resources, but it is always positive and never negative.
Wind and solar’s lower contribution to system capacity needs is not a concern, as there has always been a division of labor on the power system. The power system needs energy (MWh), capacity (MW), and flexibility (ability to ramp MW over time), and no single energy source excels at providing all three. As a result, grid operators have always relied on a mix of resources. Baseload fossil and nuclear plants provide capacity and energy but little flexibility, while peaker gas power plants provide capacity and flexibility but are costly providers of energy. Renewable energy excels at providing low-cost energy because it’s fuel is free, and it can provide some capacity and flexibility.
Fortunately, any system need for capacity and flexibility going forward can be readily provided by some of the 1,000 GW of existing power plant capacity in the U.S. Using existing capacity in this way, or even building new fossil capacity, has a negligible impact on emissions. Capacity is provided by offline power plants that are turned on during the few hours per year their output is needed. In fact, the act of providing reserves typically reduces emissions because the modestly higher system variability in a high-renewable future reduces inflexible coal generation and often benefits more flexible gas combined cycle generation. Renewable integration studies also show significantly less generation and emissions from less efficient gas combustion turbines at high renewable penetrations.
That said, a more flexible resource mix, whether from fossil, hydropower, demand response, or other innovative resources, is helpful for accommodating all sources of supply and demand variability on the power system, including wind energy. Eventually, demand response and other innovative technologies may also cost-effectively provide a large share of our need for capacity and flexibility.
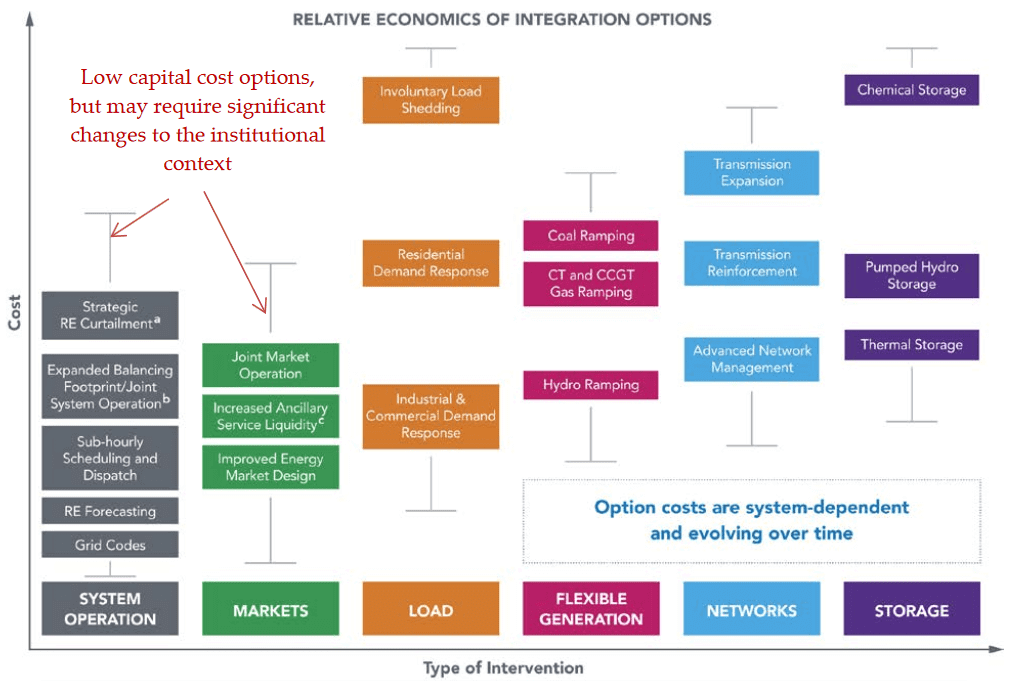
In the interim, there are many potential sources of flexibility, as shown in the table above from the National Renewable Energy Laboratory. By far the largest and cheapest source of flexibility is reforming grid operating procedures and markets to make better use of the existing flexibility on the power system.
In many regions, grid operators are not able to exchange supply and demand with neighboring power systems, the lowest-cost source of flexibility. These exchanges are particularly valuable for accommodating large amounts of renewable energy, as wind and solar output tend to be more constant over larger geographic areas because localized fluctuations cancel each other out. Grid operators can also improve power system efficiency by moving to faster markets, which more quickly respond to all forms of system variability. For example, grid operators in the Western U.S. are achieving both of those benefits by creating an Energy Imbalance Market to exchange power at fast intervals across large geographic areas.
For a more detailed discussion of how wind is integrated onto the power system, see AWEA’s Reliability White Paper
Elementary math error
The National Bureau of Economic Research working paper claims that, across 26 countries in the Organization for Economic Cooperation and Development (OECD), there is a positive correlation between the share of electric capacity provided by renewable energy and the share provided by flexible fossil-fired power plants. The study then makes the logical leap from correlation to causality to argue that flexible fossil-fired power plants are critical for integrating renewable energy. Setting aside the fallacy that correlation indicates causality, fixing a far more elementary flaw in the study’s design reveals that there is actually a negative correlation between renewable capacity and flexible fossil capacity.
Specifically, the study ignores the simple fact that when one energy source makes up a larger share of the electricity mix, other sources have to make up a smaller share. Subtracting a larger number from a given number results in a smaller number; given 1-A-B=C, making A and B larger makes C smaller, and vice versa. The apparent positive correlation between market share for renewables and flexible fossil capacity disappears once one correctly accounts for the zero sum nature of market share.
A few charts clearly show the fundamental flaw in the study. The first scatter plot illustrates the claim of the study: that there is a positive relationship between flexible fossil capacity (x-axis) and renewable capacity (y-axis) across 26 OECD countries. First, the claimed relationship is very weak to begin with. The R2 value is far below the level of statistical significance, and a linear best-fit equation only shows a 0.13 percentage point increase in renewable capacity market share for a 10 percentage point increase in flexible fossil capacity market share, or an extremely weak relationship of 1.3 to 100.
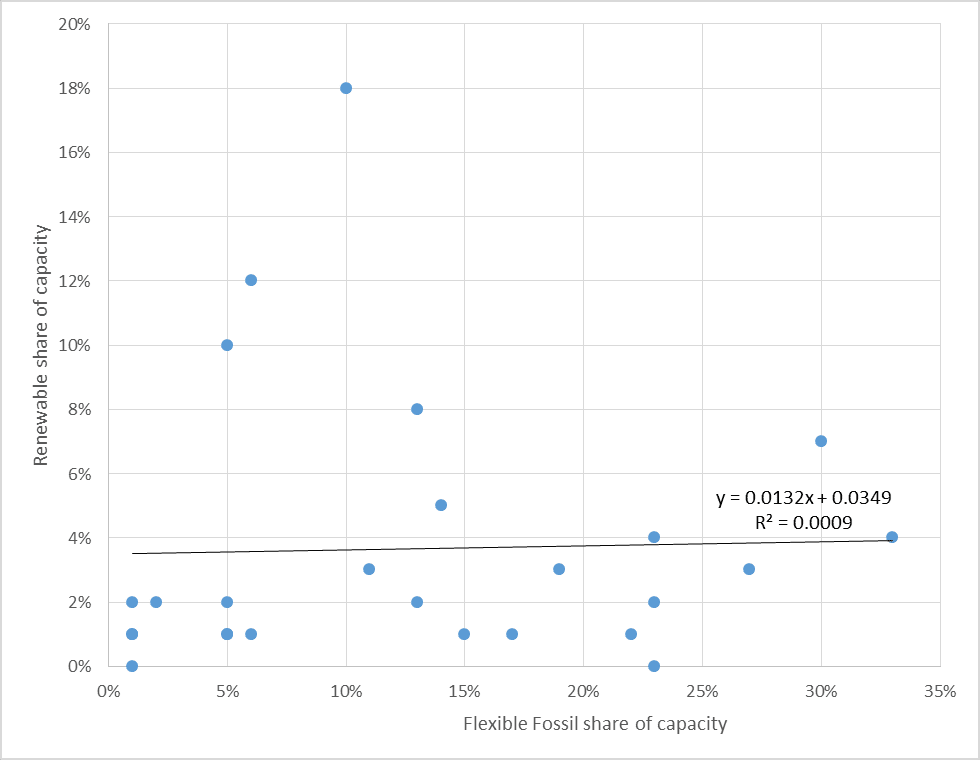
More importantly, there is a distinct cluster of nine countries in the lower left corner of the chart that do not follow the downward sloping pattern of the other dots (these nine countries appear to be seven dots in the chart above because two pairs of dots overlap). These are countries that have a very low market share for both renewable capacity and flexible fossil capacity. What countries are these?
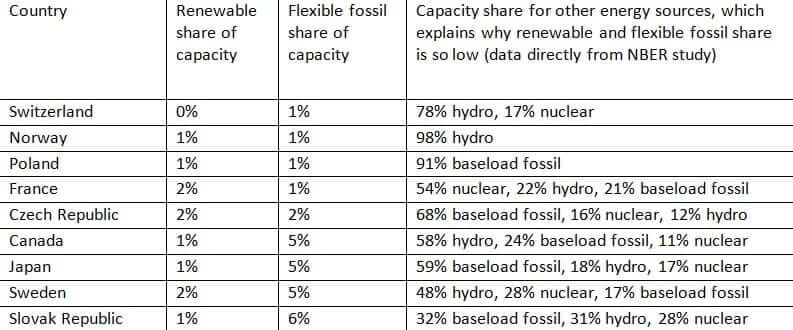
As shown in the table, these nine countries have extremely small shares of both renewable capacity and flexible fossil capacity because their capacity mix is dominated by other forms of capacity. For example, the capacity mixes in Norway, Sweden, Canada, and Switzerland are dominated by hydropower; countries like France and Japan have large shares of nuclear; and Poland and the Czech Republic are dominated by coal.
One should expect that countries dominated by other energy sources would have a small share of both renewable capacity and flexible fossil capacity, because of the simple fact that market share is zero sum and because of the economic difficulty of competing against a dominant incumbent energy source. However, the study incorrectly interprets this as indicating that the small market share of renewable capacity is caused by the small market share of flexible fossil capacity.
In the following chart, we removed the nine countries where the capacity mix is dominated by other energy sources to reduce the impact of that factor. With those nine countries removed, the results show a strong negative relationship between renewable market share and flexible fossil capacity market share, directly contradicting the authors’ claim of a positive relationship.

This is not to argue that flexible fossil capacity provides no benefit to or in some way harms renewable energy. Rather, this is once again the result of the study’s failure to account for the fact that market share is zero sum with all parts totaling 100 percent, so a larger market share for other energy sources, in this case flexible fossil generators, is inherently correlated with a smaller market share for renewable capacity. This simple but inherent mathematical relationship masks any relationship between flexibility and renewable generation in the study’s results.
Similarly, the strong negative correlation between hydropower market share and renewable market share in the authors’ dataset further undermines the study’s theory that the flexibility of fossil plants is the causal factor driving increased market share of renewable energy. Hydroelectric dams are typically far more flexible than even the most flexible fossil-fired power plants. Most dams can quickly change their electricity output by increasing or decreasing the flow of water through their turbines, and they can often turn electric output down to a very low level when the supply of other resources is high or demand is low. In contrast, even flexible fossil-fired power plants have binding physical limits on the speed at which they can change their output and how far their output can be turned down.
If the authors’ theory were correct that flexibility is the primary causal factor in their analysis, then countries with the largest hydropower market shares should see the largest market share of renewable energy. However, the failure of the study’s methodology to account for the fact that market share is inherently zero sum swamps and masks any relationship between flexible generation and renewable capacity, making it appear that there is a strong negative relationship between hydropower capacity and renewable capacity.
The study also commits the common statistics fallacy of assuming correlation indicates causality. In this case the causal factor that leads renewable market share to appear to be negatively correlated with flexible fossil capacity is the zero sum nature of market share. However, even if the data did actually show a positive correlation between renewable market share and flexible fossil market share, alternate causal explanations are possible. For example, countries with a larger share of flexible gas generation tend to have higher electricity prices, which make renewable deployment more attractive. This would be arguably more plausible than the study’s causal argument.